This is the full developer documentation for atrim.ai
# atrim.ai docs
> Point your existing OpenTelemetry at atrim.ai and the analysis starts on its own — topology, ranked critical paths, and incident detection, with nothing to install in your cluster.
Getting started
Sign in, then point your OpenTelemetry at your workspace and watch the first spans land. The whole path from landing page to your own data in atrim.ai.
[Read the walkthrough](/docs/getting-started/)
Connect your app
The endpoint, the auth header, and the per-language wiring — plus what to check when nothing shows up.
[Connect your telemetry](/docs/connect/)
Try the OTel Demo
No app to instrument yet? Run the OpenTelemetry Demo against atrim.ai and get a realistic microservice graph in a few minutes.
[Run the demo](/docs/guides/otel-demo/)
What atrim.ai does
A tour of every surface — Intelligence, Exploration, Incidents, and your workspace controls.
[See the overview](/docs/overview/)
## The surfaces
[Section titled “The surfaces”](#the-surfaces)
Critical Paths
The flagship lens: request paths ranked by where time and errors actually accumulate, with the evidence one click away.
[Read the guide](/docs/features/critical-paths/)
Metric Signals
Metrics that moved, ranked statistically against each service’s own history, with the arithmetic behind every rank on screen.
[Read the guide](/docs/features/metric-signals/)
Service Topology
The full-system map — every service a node, every call an edge, with rate, error and duration read straight off the graph.
[Read the guide](/docs/features/service-topology/)
Traces, Logs & Metrics
The three raw-data explorers behind the findings — one natural-language-first query shell over traces, logs and metric series.
[Read the guide](/docs/features/explore/)
Incidents
A complete detect → notify → resolve loop: a condition opens an incident, a message goes out, and it closes itself when the condition clears.
[Read the guide](/docs/features/incidents/)
# Page not found
> That docs page does not exist.
That page is not here. It may have moved, or the link that sent you here may be older than the docs are.
* [Getting started](/docs/getting-started/) — the path from landing page to your first spans arriving
* [Connect your app](/docs/connect/) — endpoint, auth header, per-language setup, troubleshooting
* [Try the OTel Demo](/docs/guides/otel-demo/) — a realistic microservice graph in a few minutes
* [What atrim.ai does](/docs/overview/) — a tour of every surface, top to bottom
Search is in the header, and everything here is also published as [`https://atrim.ai/llms.txt`](https://atrim.ai/llms.txt) for agents.
# Connect your app
> OTLP endpoint, API key header, per-language setup, collector config, and what to check when no data arrives.
atrim.ai is an OpenTelemetry backend. If your application already emits OTLP you do not need an SDK change, a vendor agent, or a code change — you need an endpoint and a header.
## Endpoint and authentication
[Section titled “Endpoint and authentication”](#endpoint-and-authentication)
| | |
| ---------------- | --------------------------------------- |
| **Endpoint** | `https://otlp.atrim.ai` |
| **Protocol** | OTLP over HTTP (`http/protobuf`) |
| **Signal paths** | `/v1/traces`, `/v1/metrics`, `/v1/logs` |
| **Auth header** | `x-api-key: atrim_key_…` |
Your API key is shown in the app under **Admin & Governance → Settings**. Keys look like `atrim_key_` followed by 32 hex characters.
The key selects the workspace
The API key is what decides which workspace your telemetry lands in. There is no tenant header to set — one is ignored if you send it. Treat the key like a credential: it is write access to your workspace’s data.
A request without a valid key is rejected with `401 Unauthorized`, which is also the quickest way to prove connectivity from the machine that will be sending data:
Reachability check
```
curl -i -X POST https://otlp.atrim.ai/v1/traces \
-H 'content-type: application/json' \
-d '{}'
# 401 Unauthorized → you reached atrim.ai, the key is just missing
# connection error → egress/DNS/proxy problem, not an atrim.ai problem
```
## Quick path: environment variables
[Section titled “Quick path: environment variables”](#quick-path-environment-variables)
Standard OpenTelemetry environment variables, understood by every language SDK and by the Collector. No SDK configuration, no code change:
```
export OTEL_EXPORTER_OTLP_ENDPOINT="https://otlp.atrim.ai"
export OTEL_EXPORTER_OTLP_PROTOCOL="http/protobuf"
export OTEL_EXPORTER_OTLP_HEADERS="x-api-key=atrim_key_YOUR_KEY_HERE"
export OTEL_SERVICE_NAME="your-service-name"
```
Add deployment context while you are here — it is what makes the topology and the analysis readable later:
```
export OTEL_RESOURCE_ATTRIBUTES="deployment.environment=production,service.version=1.4.2"
```
`OTEL_SERVICE_NAME` is the single most load-bearing value in that list: it is the node label in Service Topology, the grouping key for critical paths, and the identity an incident is opened against. `payment-service` is useful; `app` is not.
## Per-language setup
[Section titled “Per-language setup”](#per-language-setup)
* Node.js
Auto-instrumentation needs no code in your application at all:
```
npm install @opentelemetry/api @opentelemetry/auto-instrumentations-node
```
```
export OTEL_EXPORTER_OTLP_ENDPOINT="https://otlp.atrim.ai"
export OTEL_EXPORTER_OTLP_PROTOCOL="http/protobuf"
export OTEL_EXPORTER_OTLP_HEADERS="x-api-key=atrim_key_YOUR_KEY_HERE"
export OTEL_SERVICE_NAME="your-service-name"
node --require @opentelemetry/auto-instrumentations-node/register app.js
```
HTTP servers and clients, the common database drivers, and the popular messaging libraries are instrumented automatically. Add spans of your own with `@opentelemetry/api` where the interesting business operations are.
* Python
```
pip install opentelemetry-distro opentelemetry-exporter-otlp
opentelemetry-bootstrap -a install
```
```
export OTEL_EXPORTER_OTLP_ENDPOINT="https://otlp.atrim.ai"
export OTEL_EXPORTER_OTLP_PROTOCOL="http/protobuf"
export OTEL_EXPORTER_OTLP_HEADERS="x-api-key=atrim_key_YOUR_KEY_HERE"
export OTEL_SERVICE_NAME="your-service-name"
opentelemetry-instrument python app.py
```
`opentelemetry-bootstrap -a install` inspects your installed packages and pulls the matching instrumentation libraries, so re-run it when your dependencies change.
* Java
Download the agent once, then attach it at startup:
```
curl -L -o opentelemetry-javaagent.jar \
https://github.com/open-telemetry/opentelemetry-java-instrumentation/releases/latest/download/opentelemetry-javaagent.jar
```
```
export OTEL_EXPORTER_OTLP_ENDPOINT="https://otlp.atrim.ai"
export OTEL_EXPORTER_OTLP_PROTOCOL="http/protobuf"
export OTEL_EXPORTER_OTLP_HEADERS="x-api-key=atrim_key_YOUR_KEY_HERE"
export OTEL_SERVICE_NAME="your-service-name"
java -javaagent:./opentelemetry-javaagent.jar -jar your-app.jar
```
* Go
Go has no drop-in agent, so the exporter is wired in code. The environment variables above are still read by the SDK — this is the explicit form:
tracing.go
```
import (
"context"
"go.opentelemetry.io/otel"
"go.opentelemetry.io/otel/exporters/otlp/otlptrace/otlptracehttp"
"go.opentelemetry.io/otel/sdk/resource"
sdktrace "go.opentelemetry.io/otel/sdk/trace"
semconv "go.opentelemetry.io/otel/semconv/v1.26.0"
)
func initTracing(ctx context.Context) (*sdktrace.TracerProvider, error) {
exporter, err := otlptracehttp.New(ctx,
otlptracehttp.WithEndpoint("otlp.atrim.ai"),
otlptracehttp.WithHeaders(map[string]string{
"x-api-key": "atrim_key_YOUR_KEY_HERE",
}),
)
if err != nil {
return nil, err
}
res, err := resource.New(ctx,
resource.WithAttributes(semconv.ServiceName("your-service-name")),
)
if err != nil {
return nil, err
}
tp := sdktrace.NewTracerProvider(
sdktrace.WithBatcher(exporter),
sdktrace.WithResource(res),
)
otel.SetTracerProvider(tp)
return tp, nil
}
```
Call `tp.Shutdown(ctx)` on the way out so the last batch is flushed. `WithEndpoint` takes a host, not a URL, and defaults to TLS — use `WithInsecure()` only against a local collector.
## OpenTelemetry Collector
[Section titled “OpenTelemetry Collector”](#opentelemetry-collector)
If you already run a Collector, add atrim.ai as an **additional** exporter. Your existing backends keep receiving everything they receive today:
otel-collector-config.yaml
```
exporters:
otlphttp/atrim:
endpoint: https://otlp.atrim.ai
headers:
x-api-key: atrim_key_YOUR_KEY_HERE
service:
pipelines:
traces: { exporters: [your-existing-exporter, otlphttp/atrim] }
metrics: { exporters: [your-existing-exporter, otlphttp/atrim] }
logs: { exporters: [your-existing-exporter, otlphttp/atrim] }
```
Keep the key out of the file with the Collector’s environment-variable substitution:
```
headers:
x-api-key: ${env:ATRIM_API_KEY}
```
### On Kubernetes, add the `k8sattributes` processor
[Section titled “On Kubernetes, add the k8sattributes processor”](#on-kubernetes-add-the-k8sattributes-processor)
Running on Kubernetes? Add the [`k8sattributesprocessor`](https://github.com/open-telemetry/opentelemetry-collector-contrib/tree/main/processor/k8sattributesprocessor) to your Collector. It watches the Kubernetes API and stamps the namespace, workload, pod, and node each signal came from onto every span, metric, and log — which is what lets your service map group by namespace → workload → pod and pivot by node.
otel-collector-config.yaml
```
processors:
k8sattributes:
service:
pipelines:
traces: { processors: [k8sattributes], exporters: [otlphttp/atrim] }
metrics: { processors: [k8sattributes], exporters: [otlphttp/atrim] }
logs: { processors: [k8sattributes], exporters: [otlphttp/atrim] }
```
Without it your telemetry still arrives and every other view works — the Kubernetes hierarchy is the one thing that can’t be reconstructed after the fact, so it’s simply absent rather than guessed. I never infer a namespace or node I didn’t observe.
## Use your coding agent
[Section titled “Use your coding agent”](#use-your-coding-agent)
If your application is not instrumented yet, hand the job to whatever coding agent you already use. The prompt is short on purpose — your agent knows how to wire OpenTelemetry, and the depth it might want is at a URL it can fetch:
Paste into Claude Code, Cursor, or any coding agent
```
Send this project's OpenTelemetry to atrim.ai. Add us as an exporter — don't replace one.
endpoint: https://otlp.atrim.ai
header: x-api-key: atrim_key_YOUR_KEY_HERE
Then restart it and confirm a span arrives.
Docs: https://atrim.ai/llms.txt
```
The same prompt is offered in the product with your real credentials already filled in, and it is editable there before you copy it. [`https://atrim.ai/llms.txt`](https://atrim.ai/llms.txt) and [`https://atrim.ai/llms-full.txt`](https://atrim.ai/llms-full.txt) are these docs in a form an agent can read directly.
## Troubleshooting
[Section titled “Troubleshooting”](#troubleshooting)
Nothing has arrived. Work down this list — it is ordered by how often each one is the answer.
1. **Check the endpoint has no signal path on it.**
`OTEL_EXPORTER_OTLP_ENDPOINT` is the **base** URL: `https://otlp.atrim.ai`. The SDK appends `/v1/traces` itself. The per-signal variables (`OTEL_EXPORTER_OTLP_TRACES_ENDPOINT`) are the ones that take the full path. Setting the base variable to `https://otlp.atrim.ai/v1/traces` produces requests to `…/v1/traces/v1/traces`, which fail silently in most SDKs.
2. **Check the header, exactly.**
`x-api-key=atrim_key_…` in `OTEL_EXPORTER_OTLP_HEADERS`, `=` and not `:`, no `Bearer` prefix, no quotes inside the value. Multiple headers are comma-separated.
3. **Prove reachability from the sending machine.**
Run the `curl` above from inside the container or host that is exporting — not from your laptop. A `401` means the network path works. A timeout or DNS failure means egress rules, a proxy, or a service mesh is in the way.
4. **Check the protocol.**
Set `OTEL_EXPORTER_OTLP_PROTOCOL=http/protobuf`. An SDK left on its gRPC default will not reach an HTTP endpoint, and the failure is usually logged once at startup and never again.
5. **Turn on the SDK’s own diagnostics.**
Every SDK will tell you it failed to export if you ask it to:
```
export OTEL_LOG_LEVEL=debug # Node.js, Java
export OTEL_PYTHON_LOG_LEVEL=debug # Python
```
An export error names the cause — TLS, DNS, 401, or a malformed endpoint — far faster than anything on this page.
6. **Confirm the process is actually instrumented.**
The agent or `--require` flag has to be on the command line of the process that serves traffic, not on a wrapper script or a `Dockerfile` `ENTRYPOINT` that then `exec`s something else.
7. **Generate traffic.**
A batching exporter with no spans to send is indistinguishable from a broken one. Make a few requests against your service, then wait for the batch interval (5 seconds by default).
Still nothing? Send us the output of step 5 at — the SDK’s own export error is almost always enough to resolve it in one round trip.
# Critical Paths
> The flagship lens — request paths through your system ranked by where time and errors actually accumulate, with the evidence one click away.
Critical Paths is the first place to look. Rather than a list of slow spans, it finds the request **paths** through your system — a request entering at the frontend and fanning out through the services behind it — and ranks them by where the time and the errors actually accumulate. It is the default view atrim.ai opens on.
It lives under **Intelligence → Critical Paths**. It works on the same service graph as [Service Topology](/docs/features/service-topology/); Topology is the full-system map, Critical Paths is the ranked findings-and-analysis view of it.
Note
This surface is meant to answer “what should I look at?” without you asking. It discovers and ranks on arrival — there is no service to pick first. Ranked paths appear as soon as your data does, with descriptive names and example traces attaching as analysis completes.
## What you see
[Section titled “What you see”](#what-you-see)
The left panel lists the discovered paths, **ranked** so the one most worth your attention is at the top. Each path shows:
* **A name** describing the flow (for example, the checkout path), written by analysis.
* **A severity tag** — `critical`, `high`, `medium` or `low` — derived statistically from the path’s own history, not a fixed threshold. Hover it for how the rank was reached.
* **How many services** the path traverses.
* **Its numbers** — request rate, P95 / P99 latency, and error rate — each with a small sparkline so you can see the trend, not just the current value.
* **A short description** of what the path is.
## Staying current
[Section titled “Staying current”](#staying-current)
You don’t refresh Critical Paths. Once it’s open, it keeps pace with your system on its own — as a new critical path arises in your live traffic it appears within a few minutes, and one that recovers drops away the same way, with no click and no picker. Leave it up on a wall display and it stays honest.
If your most recent traffic is older than the last hour — a quiet service that was last busy a few days ago — atrim.ai widens the window to where your paths actually are, and tells you it did.
Note
atrim.ai picks the window that shows you your paths, so this surface needs no time-range control. When you *do* want to drive the range yourself, that’s what [Service Topology](/docs/features/service-topology/) is for.
## Following a finding to its evidence
[Section titled “Following a finding to its evidence”](#following-a-finding-to-its-evidence)
* **Select a path** to focus it. Its services light up on the topology map beside the list, and the **Explore** panel on the right keys to it.
* **View Trace** opens an example trace that exhibits the path — the concrete request behind the ranking, one click from the finding.
* **Analyze** runs the atrim.ai analysis agent over that trace to name the hop that dominates and lay out the evidence for it.
* From the **Explore** panel you can open the path’s scope directly in **Traces**, **Logs** or **Metric Explorer** when you want the raw requests, lines or metrics behind it.
You can select more than one path at a time (⌘/Ctrl-click) to compare them on the map, and filter the list — by search, or to **Critical only**, **High errors** or **Slow paths**.
Tip
Three analysis modes sit at the top of the panel. **Cross-Service** (the default) ranks paths that cross service boundaries. **In-Service** focuses within a single service and its callers. **LLM** ranks GenAI/model call paths for AI-heavy workloads.
## Read-only by design
[Section titled “Read-only by design”](#read-only-by-design)
Critical Paths surfaces and explains. Running the analysis agent over a trace is a read-only explanation of your own data — nothing atrim.ai does here reaches into your infrastructure or holds your credentials.
[Service Topology](/docs/features/service-topology/)The full-system map behind these findings — every service and call, with rate, error and duration.
[Incidents](/docs/features/incidents/)When a condition is worth telling someone about, the detect → notify → resolve loop takes over.
# Explore: Traces, Logs & Metrics
> The three raw-data explorers behind the Intelligence surfaces — one shared query shell over traces, logs and metrics, natural-language-first, with a chart and an insights rail.
The Exploration explorers are where you go from a finding to the raw requests, lines and metric series behind it. There are three — **Traces**, **Logs** and **Metric Explorer** — and they share one query shell, so learning one teaches you the others. If you have used Datadog or Honeycomb this will feel familiar; this page covers what is specific to atrim.ai.
They live under **Exploration → Traces / Logs / Metric Explorer**. You usually arrive here from [Critical Paths](/docs/features/critical-paths/) or [Metric Signals](/docs/features/metric-signals/) — those surfaces hand off a query pre-scoped to what you were looking at — but each opens on its own with recent data loaded.
## The shared shell
[Section titled “The shared shell”](#the-shared-shell)
Every explorer has the same three parts:
* **A natural-language-first query bar.** Describe what you want in plain English — for traces, *“slow failed checkout requests”* — and **Interpret** turns it into a structured query and runs it in one step. The structured filter controls sit right below, always visible, so you can refine the interpretation by hand: the inferred filters appear as editable **pills**, and a pill that a later edit overrode is shown struck through rather than silently dropped.
* **A results area** with a **Chart / Table / Both** toggle (Both by default). The chart is derived from the rows on the current page — its caption says so — not a full-window rollup, so it is a fast read of what you fetched, not a separate aggregate query.
* **An Insights rail** on the right (open by default) that summarises the window.
Note
Interpreting a query is an LLM call that infers *filters* — it never executes anything on its own beyond running the query it produced. If you have already pinned a time range, an inferred one is noted and ignored rather than overriding your choice.
Each explorer’s query round-trips through the URL — `?tq=` for traces, `?lq=` for logs, `?mq=` for metrics — so Back, refresh and a shared link all restore the same filters, natural-language text and time range.
## Traces
[Section titled “Traces”](#traces)
Traces filters on the R.E.D. signals — **Rate**, **Errors** and **Duration** — plus **Services** and **Endpoints** (endpoints narrow to the services you pick). Results come as a table with a **Traces / Spans / Errors / Avg Duration / Services** summary bar and a **Group by Trace** toggle that flips between individual spans and whole traces.
From any row you can open the **trace timeline**, view its details, or **filter by this row** to pivot the query. The timeline itself is a waterfall with the **critical path overlaid**, a span tree you can search and expand, a minimap, and — below it — the **logs that share the trace’s ID**. Any one trace can be sent through **Deep Trace Analysis**, the atrim.ai agent, for a written read of where the time or the error went.
## Logs
[Section titled “Logs”](#logs)
Logs filters on **Levels**, **Services**, **Environment**, and a body-contains substring. Two projections of the same window sit behind a **Rows / Patterns** toggle: **Rows** is the individual lines (Time, Level, Service, Message, Trace, expandable to the full body and attributes); **Patterns** groups them into templates with a count, severity and example traces, and drilling a pattern filters Rows to it. A **Live tail** switch polls the Rows view every few seconds for a running feed.
Tip
Logs is the one explorer with an agent behind its Insights rail. Press **Analyze** and atrim.ai reads the current log window and writes up what it finds. It is on-demand — the rail disarms whenever you change the filters, so editing a query never quietly spends another analysis.
## Metric Explorer
[Section titled “Metric Explorer”](#metric-explorer)
Metric Explorer queries the raw OTLP metrics — filter by **metric name**, **type**, **service**, a value band (`value >` / `value <`), and **environment**. The results table lists each series with its shape, sources and min/max; **click a row to chart that series**, and ⌘/Ctrl-click to overlay a second. A `value >` or `value <` filter also draws as a dashed **threshold line** on the chart. Each point traces back to its exact requests through OTLP exemplars, so you can go from a metric spike to the traces behind it.
If a workspace has not sent OTLP metrics recently, the explorer says so plainly and points you at Traces and Metric Signals instead of showing an empty grid.
## What the insights are
[Section titled “What the insights are”](#what-the-insights-are)
Each rail is honest about how it was produced. On **Traces** and **Metric Explorer** the Insights rail is a **counted read** of the rows you fetched — a fast, exact summary and a “what stands out” list computed by arithmetic, labelled as such. On **Logs**, the rail runs an actual analysis agent over the window. So an insight is never dressed up as more than it is: the explorers show you the raw data faithfully, and where an agent read is offered, it is a real one.
[Critical Paths](/docs/features/critical-paths/)Where a Traces or Metrics query often starts — request paths ranked, with 'open in Traces / Logs / Metrics' one click away.
[Metric Signals](/docs/features/metric-signals/)The detected-metrics surface that hands a scoped query straight into Metric Explorer.
# Incidents
> A complete detect → notify → resolve loop — a condition opens an incident, a message goes out, and it closes itself when the condition clears.
Incidents is the part of atrim.ai that tells you when something is wrong instead of waiting for you to go looking. A condition in your telemetry opens an incident, a notification goes out, and the incident closes itself when the condition clears. It is a complete loop, not a queue you have to poll.
It lives under its own top-level **Incidents** entry and is **on by default**.
Note
Detection runs on its own. atrim.ai watches your telemetry and opens incidents from what it already finds — the same signals behind Critical Paths and its statistical baselines. There are no thresholds for you to set up before it works.
## How the loop behaves
[Section titled “How the loop behaves”](#how-the-loop-behaves)
* **Detect.** atrim.ai evaluates your telemetry on a periodic cycle (about every five minutes). A condition has to persist across two consecutive cycles before an incident opens — a single bad cycle will not page you.
* **Notify.** When an incident opens, a message goes to your sign-up email and/or a webhook you have set up. A second message goes out when it resolves.
* **Resolve.** When the condition has been clear for two consecutive cycles, the incident resolves itself. An incident whose signal simply goes quiet is force-resolved after a few hours so nothing lingers as firing forever.
An incident moves through **firing → acknowledged → resolved**. You can acknowledge one to show it is being handled, and it still auto-resolves when the condition clears.
## The list
[Section titled “The list”](#the-list)
The Incidents list shows each incident with its **severity** (`critical` / `warning` / `info`), its **state**, its **title** and the **services it affects**, and when it last fired. Firing incidents are tinted so they stand out, and a recurrence badge marks one that has fired more than once. Filter by service, state or severity; acknowledge or resolve inline, singly or in bulk. When there is nothing active you get an **All Clear!** panel rather than an empty table.
## An incident in detail
[Section titled “An incident in detail”](#an-incident-in-detail)
Opening an incident shows:
* **AI Analysis** — a written summary of impact, probable cause and suggested next steps, already on the record when you open it. To size the impact, I walk the service graph your traffic draws and measure the **blast radius** — the downstream services that depend on what broke — then weigh it with the incident’s severity and whether it hit during business hours.
* **Overview** — the affected services, the evidence (links to the traces and the time window behind it), and metadata such as when it was first seen and how many times it has recurred.
* **Timeline** — the audit log: created, acknowledged, resolved, reopened.
* **Deliveries** — every notification attempt, its channel and target, and whether it was delivered.
From here you can **Acknowledge**, **Resolve** (with an optional note), **Snooze** it for a set period, jump to the underlying requests with **Investigate**, or run **Analyze Root Cause** over its trace.
## Notifications
[Section titled “Notifications”](#notifications)
* **Email** goes to the address you signed up with — no setup, no counterparty to configure first.
* **Webhooks** are managed under **Settings → Alerting**. Create, edit and **test-fire** them in-product, and filter each one by severity so a webhook only receives what you want. A Discord webhook URL is recognised and formatted for Discord automatically.
[Critical Paths](/docs/features/critical-paths/)Where many incidents originate — the ranked request paths through your system.
[What atrim.ai does](/docs/overview/)A tour of every surface — Intelligence, Exploration, Incidents, and your workspace controls.
# Metric Signals
> Metrics that moved, ranked statistically against each service's own history — a workload overview, a ranked concern list, and the deterministic evidence behind every rank.
Metric Signals is the metrics half of Intelligence: instead of a wall of dashboards you read yourself, it surfaces the metrics that **moved** — ranked by how far each one deviated from its own recent history — and hands each one off to the raw data with the arithmetic behind the rank on screen. It gives you the ranked signal directly, instead of a dashboard you read yourself.
It lives under **Intelligence → Metric Signals**. Where [Critical Paths](/docs/features/critical-paths/) ranks request *paths*, Metric Signals ranks individual *metric* concerns; both are the “here is what to look at” surfaces that hand off to the user-driven [explorers](/docs/features/explore/).
Note
The ranking is statistical and done on the server. atrim.ai compares each metric against a baseline built from that service’s **own** history and ranks by the size of the deviation — there are no fixed thresholds you configure first, and the browser never re-sorts what the detector produced.
## What you see
[Section titled “What you see”](#what-you-see)
The surface is a three-panel triage view, with an optional overview band across the top.
### Workload overview
[Section titled “Workload overview”](#workload-overview)
Toggle **Overview** (top right) for a treemap of your services, each tile **sized by request volume** and **coloured by statistical severity**. Click a tile to filter the concern list to that service. Area and rank disagree on purpose: volume is a tiebreaker the score deliberately excludes, so a small-but-badly-deviating service still ranks above a large calm one.
### What needs attention — the ranked list
[Section titled “What needs attention — the ranked list”](#what-needs-attention--the-ranked-list)
The left panel, headed **What needs attention**, is the concern list in fixed rank order. Each concern is a card:
* **A severity pill** — `LOW` / `MEDIUM` / `HIGH` / `CRITICAL` with the numeric score beside it. Hover it for the provenance: the deviation, the confidence, and which estimator produced it.
* **Its rank** — `#1`, `#2`, … — the position the detector assigned, not a tier.
* **A title** describing the concern, written by analysis.
* **Its scope** — namespace / service, and the operation or emitter the concern is about.
* **A sparkline** with an expected-range sleeve, so you can see the movement, not just the current value, and a footer with the observed value and how many standard deviations out it is.
### Evidence and the Finding
[Section titled “Evidence and the Finding”](#evidence-and-the-finding)
Selecting a concern fills the **centre** and **right** panels:
* The **evidence workspace** (centre) charts the observed series against its baseline and expected range, and shows a **deterministic evidence** strip that spells the score out as `deviation × confidence × signal-type weight` — severity is a projection of that number, not the sort key. Below it, **Correlated concerns** lists other concerns in the window that move with this one.
* The **Finding** panel (right) explains *why it ranks here*, offers **Copy for agent** (the finding and its ranking arithmetic, as text to paste into your own LLM), and a **Handoff preview** showing exactly which query the explorer will open with.
## The controls
[Section titled “The controls”](#the-controls)
Three selectors in the header shape what is evaluated:
* **Time window** — `5 min` through `1 day` — the window detection runs over.
* **Baseline** — `7d` or `30d` — how far back the “own history” comparison reaches.
* **Sensitivity** — from **All anomalies** to **Critical only**, defaulting to **Tenant default**. Lower shows more; higher shows only the extreme. This is the recall dial; there are no per-metric thresholds to author.
## How the ranking works
[Section titled “How the ranking works”](#how-the-ranking-works)
Every concern’s rank is a continuous score — the deviation from baseline, scaled by a confidence term and a per-signal-type weight — computed on the server against the service’s own history. atrim.ai numbers that order 1-based and never reorders it in the browser; the only rearrangement is moving telemetry with no clear service identity to the end, clearly labelled. **Request volume is never a term in the score** — it is only ever a tiebreaker for impact, never a reason something ranks. An LLM names the findings; it cannot change a severity or a rank, and is not given the underlying figures.
## Coverage, in plain sight
[Section titled “Coverage, in plain sight”](#coverage-in-plain-sight)
The ranking is never a black box. A footer under the list shows how many series were evaluated and how many surfaced concerns, so the basis for the order is always on screen. A quiet window says so directly instead of implying more than it looked at, and while baselines are still building from your history the surface tells you that too — the signal sharpens as more data arrives.
## Read-only by design
[Section titled “Read-only by design”](#read-only-by-design)
Metric Signals surfaces and explains, and holds none of your credentials. The handoff buttons only *navigate* to read-only explorers; **Analyze** is an on-demand explanation that cannot change the statistics behind a concern; and the ranking only ever uses the numbers you sent — atrim.ai never invents a figure it was not given.
[Explore: Traces, Logs & Metrics](/docs/features/explore/)Where a concern hands off — the raw requests, lines and metric series behind the rank.
[Critical Paths](/docs/features/critical-paths/)The other Intelligence lens: request paths ranked by where time and errors accumulate.
# Service Topology
> The full-system service map — every service as a node, every call as an edge, with rate, error and duration read straight off the graph.
Service Topology is the map of your system. Every service that reports telemetry is a node, every call between services is an edge, and the rate, error rate and latency of each are read straight off the graph — so the slow and failing parts of the system are visible before you open a single trace.
It lives under **Exploration → Service Topology**. It is the full-system view; the ranked, path-focused analysis of the same graph lives under **Intelligence → Critical Paths**. The same graph also sizes an incident’s blast radius: when a service degrades, [Incidents](/docs/features/incidents/) walks its downstream dependents to score the impact — what depends on it, and what feels it.
Note
Topology is built from aggregated dependency tables that fill in a few minutes after your first data arrives. Until they are ready the map is served directly from raw traces and shows a calm **Building your service map…** notice; it fills in and the notice clears on its own. See [While your map is building](#while-your-map-is-building) below.
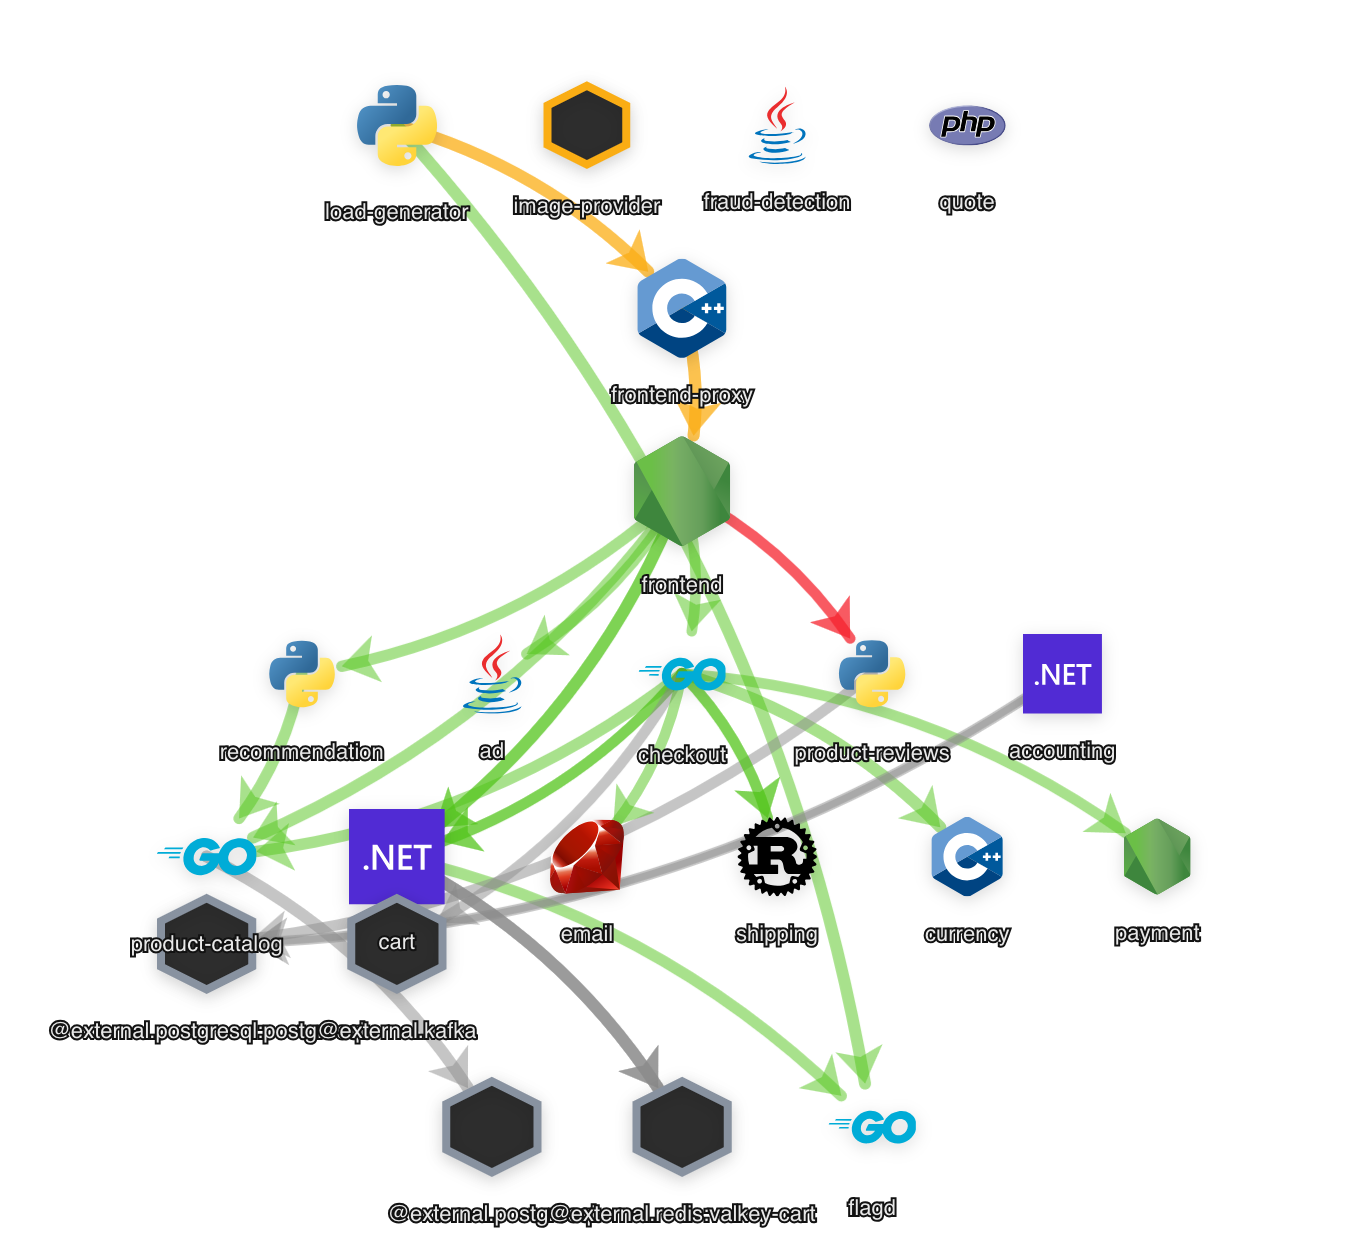
## Reading the map
[Section titled “Reading the map”](#reading-the-map)
### Nodes are services
[Section titled “Nodes are services”](#nodes-are-services)
Each node is one service. Its **icon** is the service’s language or SDK, and its **label** is the service name (prefixed with its namespace when there is one).
* **Size is traffic.** A busier service — more requests per second — draws a larger node.
* **Colour is health.** A ring around each node is green (**Healthy**), amber (**Warning**) or red (**Critical**), taking the worst of the service’s rate, error and latency signals. A grey node is one atrim.ai has **no metrics** for yet — either an uninstrumented peer, or a service seen only as the far end of a call. A legend under the graph names the colours.
Hover a node for its numbers: **Rate** (req/s), **Errors** (%), **P95 Latency** (ms) and **Spans**, each flagged healthy / warning / critical, with a short note on what to look at when it is not healthy.
### Edges are calls
[Section titled “Edges are calls”](#edges-are-calls)
An edge is a call dependency, drawn from caller to callee — the **arrowhead points the way the call flows**. A thicker edge carries more calls. Hover an edge for the total call count and a breakdown of the top operations behind it.
### The header strip
[Section titled “The header strip”](#the-header-strip)
Above the graph, three gauges summarise the fleet — **Performance** (latency health), **Reliability** (error-rate health) and **Telemetry** (how much of your system is reporting) — alongside a plain `healthy / total` count and how many services **need attention**.
## Working the graph
[Section titled “Working the graph”](#working-the-graph)
* **Click a service** to open its drawer on the right. The rest of the map dims so the service and its neighbours stand out. The drawer has three tabs: **Trace Diff** (compare this service’s behaviour against a baseline), **Metrics** (its rate / error / P95 tiles, a latency band over time, and the issues detected on it) and **Logs** (its recent lines). The Metrics and Logs tabs each open the same scope in **Metric Explorer** or **Logs** in one click.
* **Filter the Services list** on the left to jump to a service by name or namespace.
* **Refresh** (the button on the graph) recomputes the map from your current traces — use it after you have changed something and want to see the effect now.
* **Analyze** (in the global header) recomputes the map’s statistics on demand.
* **Time range and auto-refresh** come from the global header controls: pick the window, and choose whether the map re-polls every minute, every five minutes, or only when you ask.
* **Zoom, fit and drag** live on the graph itself; node positions you drag are remembered.
### External peers
[Section titled “External peers”](#external-peers)
Databases, caches, queues and third-party APIs that your services call but that do not report telemetry of their own are inferred from outbound calls and drawn as **external** nodes. They are shown by default. To hide them and see only services that report telemetry, turn off **Settings → Appearance → Service Topology → Show external dependencies**.
## While your map is building
[Section titled “While your map is building”](#while-your-map-is-building)
On a brand-new workspace the aggregated tables that back the map are still warming for the first few minutes after data starts arriving. During that window atrim.ai serves the map directly from your raw traces and shows a calm notice:
> **Building your service map…** — Analyzing your telemetry; services and their connections fill in as data is aggregated. This updates automatically.
You do not need to do anything. Services appear as their first requests land, edges fill in as the dependency tables populate, and the notice clears itself once the aggregated map is ready — the view polls every few seconds while it warms.
If the map ever looks sparse, adjusting the time range usually settles it while the aggregated tables catch up.
[Critical Paths](/docs/features/critical-paths/)The ranked, path-focused analysis of this same graph — where time and errors actually accumulate.
[Connect your app](/docs/connect/)Not seeing your services yet? Endpoint, auth header, and what to check when no data arrives.
# Settings
> Your workspace's API key and endpoint, alerting webhooks, appearance, account and plan — the Admin & Governance surface a first customer actually touches.
Settings is where your workspace’s own configuration lives — the OTLP credential, the notification webhooks, appearance, your account, and (when enabled) your plan. Most of it is self-explanatory; this page is the map of what is where.
It lives under **Admin & Governance → Settings**. Sections that depend on a workspace feature — **Alerting** and **Billing** — appear only when that feature is on.
## Connecting your app
[Section titled “Connecting your app”](#connecting-your-app)
**Settings → App Onboarding** holds your **Project API Key** and the ready-to-paste exporter config, the same credential the [getting-started](/docs/getting-started/) flow shows you. You can **show / hide** the key, **copy** it, and see when it was created and last used. The **Example Configuration** card offers **Environment Variables**, **OTel Collector**, **Node.js** and **Python** snippets, each built with your real endpoint and key.
A **Connection Check** (“Check for traces”) on the same screen polls for arriving telemetry and tells you what it sees; when nothing arrives it links straight to the [connection diagnostics guide](/docs/connect/#troubleshooting).
Caution
**Regenerate API Key** (in the section’s Danger Zone) invalidates the current key immediately — any service still using the old key stops sending until you update it.
## Alerting webhooks
[Section titled “Alerting webhooks”](#alerting-webhooks)
**Settings → Alerting** is where the notification side of [Incidents](/docs/features/incidents/) is configured, on the **Webhooks** tab. **Add Webhook** takes a **Name**, a **URL**, an optional **signing secret** (sent as an `X-Atrim-Signature` HMAC-SHA256 header so you can verify deliveries), and a **severity filter** — Critical / Warning / Info — so a webhook only receives what you choose. Each webhook can be paused, edited, deleted, and **test-fired** in place, so you can confirm it works before an incident depends on it.
Tip
Paste a **Discord** webhook URL into the same **URL** field and nothing else changes — atrim.ai recognises the Discord host and formats the payload as a Discord embed automatically. Every other URL receives the standard atrim.ai JSON envelope.
Email needs no setup here: incident notifications also go to your sign-up address by default. A **Detection** tab shows that detection runs automatically every five minutes and lets an admin convert pending findings to incidents on demand.
## Appearance
[Section titled “Appearance”](#appearance)
**Settings → Appearance** sets the colour scheme — **System**, **Light**, **Dark**, or the branded atrim.ai mode — saved to your account. A **Service Topology** control here, **Show external dependencies**, toggles whether uninstrumented peers (databases, caches, queues, third-party APIs) inferred from outbound calls are drawn on the [map](/docs/features/service-topology/). Turn it off to see only services that report telemetry of their own.
## General and account
[Section titled “General and account”](#general-and-account)
* **Settings → General** shows your **Tenant ID** and a live **Platform Status** readout. Its **Danger Zone** holds **Reset Tenant Data** — a one-action wipe of all telemetry and analysis (traces, logs, metrics, topology, baselines, incidents) that **keeps** your settings, API keys, webhooks and billing. It is handy right after onboarding with a test app. Only a workspace **owner or admin** can run it; a member sees why it is unavailable rather than a dead button.
* **Settings → Profile** shows your email and connected sign-in providers, and can delete your account.
* **Settings → Billing** (when enabled) shows your plan or trial and opens the Stripe portal to manage your card, invoices or cancellation — those details deliberately live in Stripe, not here.
Note
Some operator-only tools that manage the deployment itself aren’t part of your workspace and won’t appear for your account.
[Connect your app](/docs/connect/)The endpoint, the auth header, per-language setup, and troubleshooting when nothing arrives.
[Incidents](/docs/features/incidents/)What those webhooks deliver — the detect → notify → resolve loop they plug into.
# Getting started
> From the atrim.ai landing page to a workspace with your own telemetry in it, in a few minutes.
atrim.ai turns your existing OpenTelemetry into topology, ranked critical paths, and automatic analysis — you point your data at it and the work starts on its own. This is the whole path from the landing page to your first spans arriving.
## The path
[Section titled “The path”](#the-path)
1. **Land and pick a route.** Open [atrim.ai](https://atrim.ai). Two ways in, each one click:
* **Connect my app** — you already emit OpenTelemetry and want your own services in.
* **Explore the demo** — nothing to connect yet, so start on a live OpenTelemetry demo with incidents firing throughout the day and see what atrim.ai does with it.
2. **Sign in.** A magic link to your email, or GitHub — one step, and your workspace is ready.
3. **Copy your config.** You get an API key and the OTLP endpoint, ready to paste — the key is what routes your telemetry to your workspace. The **App** route needs no code change; the **Collector** route adds an exporter beside the ones you already run.
4. **Watch it arrive.** The app watches for your first spans and tells you what it sees — the service name, the span count, and which signal arrived. If nothing shows up, the same screen links to [troubleshooting](/docs/connect/#troubleshooting).
5. **Explore.** Once data is arriving, start at **Critical Paths** — the ranked view of where time and errors actually accumulate — or open **Service Topology** for the map.
## Copy the config
[Section titled “Copy the config”](#copy-the-config)
The **App** route needs no SDK and no code change — four standard OpenTelemetry environment variables:
Environment variables
```
OTEL_EXPORTER_OTLP_ENDPOINT=https://otlp.atrim.ai
OTEL_EXPORTER_OTLP_PROTOCOL=http/protobuf
OTEL_EXPORTER_OTLP_HEADERS=x-api-key=atrim_key_YOUR_KEY_HERE
OTEL_SERVICE_NAME=your-service-name
```
The **Collector** route adds an exporter rather than replacing one, so whatever you already send telemetry to keeps receiving it. Both snippets, and the full per-language reference, are on [Connect your app](/docs/connect/).
Using a coding agent?
The onboarding flow hands you a short prompt — your credentials plus a pointer. Your agent already knows how to wire OpenTelemetry, and the depth it might want lives at [`https://atrim.ai/llms.txt`](https://atrim.ai/llms.txt), which it can fetch. The prompt is editable in the UI before you copy it.
## Where to look next
[Section titled “Where to look next”](#where-to-look-next)
atrim.ai groups its surfaces into four entry points. Once your first traces land:
* **Intelligence** — start here. [**Critical Paths**](/docs/features/critical-paths/) ranks the request paths through your system by where the time and the errors actually are. [**Metric Signals**](/docs/features/metric-signals/) surfaces the metrics that moved.
* **Exploration** — [**Service Topology**](/docs/features/service-topology/) for the map, and the [**Traces, Logs & Metrics**](/docs/features/explore/) explorers for individual requests, lines and ad-hoc metric queries.
* [**Incidents**](/docs/features/incidents/) — automatic detection with a full lifecycle: an incident that opens on a real condition and closes itself when the condition clears.
* [**Admin & Governance**](/docs/features/settings/) — your API key, alerting webhooks, appearance, and account.
[Connect your app](/docs/connect/)Endpoint, auth header, per-language setup, collector config, and troubleshooting.
[Try the OTel Demo](/docs/guides/otel-demo/)A realistic microservice graph without instrumenting anything of your own.
# Try the OTel Demo
> Run the OpenTelemetry Demo against atrim.ai to get a realistic microservice graph without instrumenting anything of your own.
The [OpenTelemetry Demo](https://github.com/open-telemetry/opentelemetry-demo) is a shopping site built from about twenty services in a dozen languages, all instrumented, with a load generator and a set of deliberate failure modes you can switch on. It is the fastest way to see what atrim.ai does with a system that is genuinely distributed — no instrumentation work of your own required.
The demo is designed to bring your own backend: its collector reads an extras file that is merged over the base config, so adding atrim.ai is a few lines and changes nothing else about how the demo runs.
Note
This is a real workload on your machine — roughly 6 GB of RAM and a few GB of images. If you only want to look around, the **Explore the demo** route on the [atrim.ai](https://atrim.ai) landing page drops you into a live demo workspace — one magic-link sign-in, nothing to install.
## Point the demo at atrim.ai
[Section titled “Point the demo at atrim.ai”](#point-the-demo-at-atrimai)
1. **Clone the demo.**
```
git clone --depth 1 --branch 3.0.0 \
https://github.com/open-telemetry/opentelemetry-demo.git
cd opentelemetry-demo
```
2. **Add atrim.ai as an extra exporter.**
Edit the demo’s `otelcol-config-extras.yml` (under `src/otel-collector`) — the file it provides for exactly this purpose. It is deep-merged over the base collector config, so the demo’s own Jaeger, Prometheus and OpenSearch pipelines keep working:
src/otel-collector/otelcol-config-extras.yml
```
exporters:
otlphttp/atrim:
endpoint: https://otlp.atrim.ai
headers:
x-api-key: atrim_key_YOUR_KEY_HERE
timeout: 30s
service:
pipelines:
traces:
exporters: [otlphttp/atrim]
metrics:
exporters: [otlphttp/atrim]
logs:
exporters: [otlphttp/atrim]
```
Your key is in the app under **Admin & Governance → Settings**.
3. **Start it.**
```
docker compose up --force-recreate --remove-orphans --detach
```
The demo’s own UI comes up at `http://localhost:8080`. Its load generator starts producing traffic immediately, so you do not have to click anything for data to flow.
4. **Watch it arrive in atrim.ai.**
First spans usually land within a minute. Services appear as they take their first request, so the graph fills in rather than appearing all at once.
## What to look at
[Section titled “What to look at”](#what-to-look-at)
**Service Topology** is the obvious first stop — the demo’s call graph is deep enough to be interesting, with a frontend fanning out to cart, checkout, payment, shipping, currency and product catalog, and a Kafka hop between checkout and the downstream services. Every edge carries rate, error and duration, so the slow and failing hops are visible on the map before you open a single trace.
**Critical Paths** is where the demo earns its keep. Rather than a list of slow spans, it ranks the request *paths* through the system by where the time and the errors actually accumulate, which for this workload means the checkout flow and its Kafka-mediated tail. Open one and analyse it: the analysis names the hop that dominates and what the evidence for that is.
**Traces** and **Logs** are there when you want the individual request or line behind a finding rather than the aggregate.
## Break something on purpose
[Section titled “Break something on purpose”](#break-something-on-purpose)
The demo ships feature flags that inject real failures. Turn one on at `http://localhost:8080/feature`, leave it running for a few minutes, and watch what changes in atrim.ai:
| Flag | What it does | Where it shows up |
| ----------------------- | --------------------------------------------------------------- | ------------------------------------------------------------------- |
| `paymentFailure` | Fails a chosen percentage of payment charges (10% through 100%) | Error rate on the payment node; the checkout critical path degrades |
| `cartFailure` | Cart operations fail | Cart node turns red; failing traces in the checkout path |
| `productCatalogFailure` | Product catalog errors on one specific product | A subset of requests fail — a partial failure, not a total one |
| `adManualGc` | Forces garbage collection in the ad service | Latency spikes with no change in error rate |
| `kafkaQueueProblems` | Kafka queue overload and consumer lag | Latency on the asynchronous hop out of checkout |
The partial failures are the interesting ones. A service that is entirely down is easy for any tool to find; a service that fails for one product, or gets slower without failing, is the case that separates a topology view from a dashboard.
## Clean up
[Section titled “Clean up”](#clean-up)
```
docker compose down --volumes --remove-orphans
```
Your telemetry stays in atrim.ai after the demo is gone, so the topology and the critical paths you were looking at are still there.
# What atrim.ai does
> Point your existing OpenTelemetry at atrim.ai and get topology, ranked critical paths, metric signals, and automatic incident detection — the analysis starts on its own.
You point your existing OpenTelemetry at atrim.ai and the analysis starts on its own — no dashboards to build first, no thresholds to configure, nothing to install in your cluster. This page is the map of what you get, organised by the four entry points in the product’s navigation.
Early access
You are among the first teams using atrim.ai, and we work closely with our early partners — we would love your feedback.
## Intelligence — what to look at, ranked for you
[Section titled “Intelligence — what to look at, ranked for you”](#intelligence--what-to-look-at-ranked-for-you)
| | |
| ------------------ | ----------------------------------------------------------------------------------------------------------------------------------------------------------------------------- |
| **Critical Paths** | The request paths through your system, ranked by where time and errors actually accumulate, with on-demand analysis of any one of them and the evidence one click away. |
| **Metric Signals** | The metrics that moved, ranked statistically against each service’s own history — a workload overview, a ranked concern list, and the arithmetic behind every rank on screen. |
## Exploration — the raw data, one query shell
[Section titled “Exploration — the raw data, one query shell”](#exploration--the-raw-data-one-query-shell)
| | |
| -------------------- | ------------------------------------------------------------------------------------------------------------ |
| **Service Topology** | The full-system service graph, with rate, error and duration on every node and edge. |
| **Traces** | Individual traces and waterfalls with the critical path overlaid, searchable and filterable. |
| **Logs** | Log search and pattern grouping, with an agent that reads a window and writes up what it finds. |
| **Metric Explorer** | Ad-hoc metric queries straight over your raw OTLP metrics, with exemplars back to the traces behind a spike. |
## Incidents — detect, notify, resolve, on its own
[Section titled “Incidents — detect, notify, resolve, on its own”](#incidents--detect-notify-resolve-on-its-own)
A condition in your telemetry opens an incident, a message goes to your sign-up email and/or a webhook you created, and the incident closes itself when the condition clears. It is a complete loop, on by default, with detection that runs without any thresholds for you to set up first.
Webhooks are created, edited and **test-fired** in-product, filtered by severity, and a Discord webhook URL is recognised and formatted automatically.
## Admin & Governance — your workspace, your control
[Section titled “Admin & Governance — your workspace, your control”](#admin--governance--your-workspace-your-control)
| | |
| ------------------------ | --------------------------------------------------------------------------------------------------------------------------------------- |
| **API key and endpoint** | Your OTLP endpoint and key, ready to copy from the app. |
| **Sign-up** | A magic link to your email, then your workspace. |
| **Reset Tenant Data** | A one-action wipe of telemetry and analysis that keeps your settings, keys and webhooks — handy right after onboarding with a test app. |
## Works with your coding agent
[Section titled “Works with your coding agent”](#works-with-your-coding-agent)
These docs are published as [`llms.txt`](https://atrim.ai/llms.txt) and [`llms-full.txt`](https://atrim.ai/llms-full.txt) so a coding agent can read them directly, and the onboarding flow hands you a short prompt to paste into whichever agent you already use.
Read-only by design
atrim.ai surfaces and explains — it does not act on your systems and holds none of your credentials. Every analysis run is a read-only explanation of your own data.
[Getting started](/docs/getting-started/)From the landing page to a workspace with your own telemetry in it.
[Connect your app](/docs/connect/)Endpoint, auth header, per-language setup, collector config, and troubleshooting.