Alerting and Notifications
Detection is on from the moment your data arrives: every detector runs, with defaults that need no thresholds from you. Two settings pages let you shape it. Alerting decides what fires and how loud; Notifications decides where it goes. Both are in Settings, under Integrations.
Alerting — what fires and how loud
Section titled “Alerting — what fires and how loud”The Alerting page lists every detector in its Detection tuning card, split into two tables by how a detector decides to fire:
- Baseline alarms fire when a signal moves away from its own recent normal — Per-service RED (error / latency / resource), Per-dependency RED (edge A→B) between two services, and Traffic drop / spike. They adapt to what’s normal for each service, or for your workspace as a whole, and need traffic to compare against.
- Condition alarms fire when a stated condition holds, whatever the baseline says — Traffic onset / went-dark for your whole workspace, and Service absence (heartbeat) when a service you’ve seen goes quiet. They cover what a baseline can’t see once traffic stops.
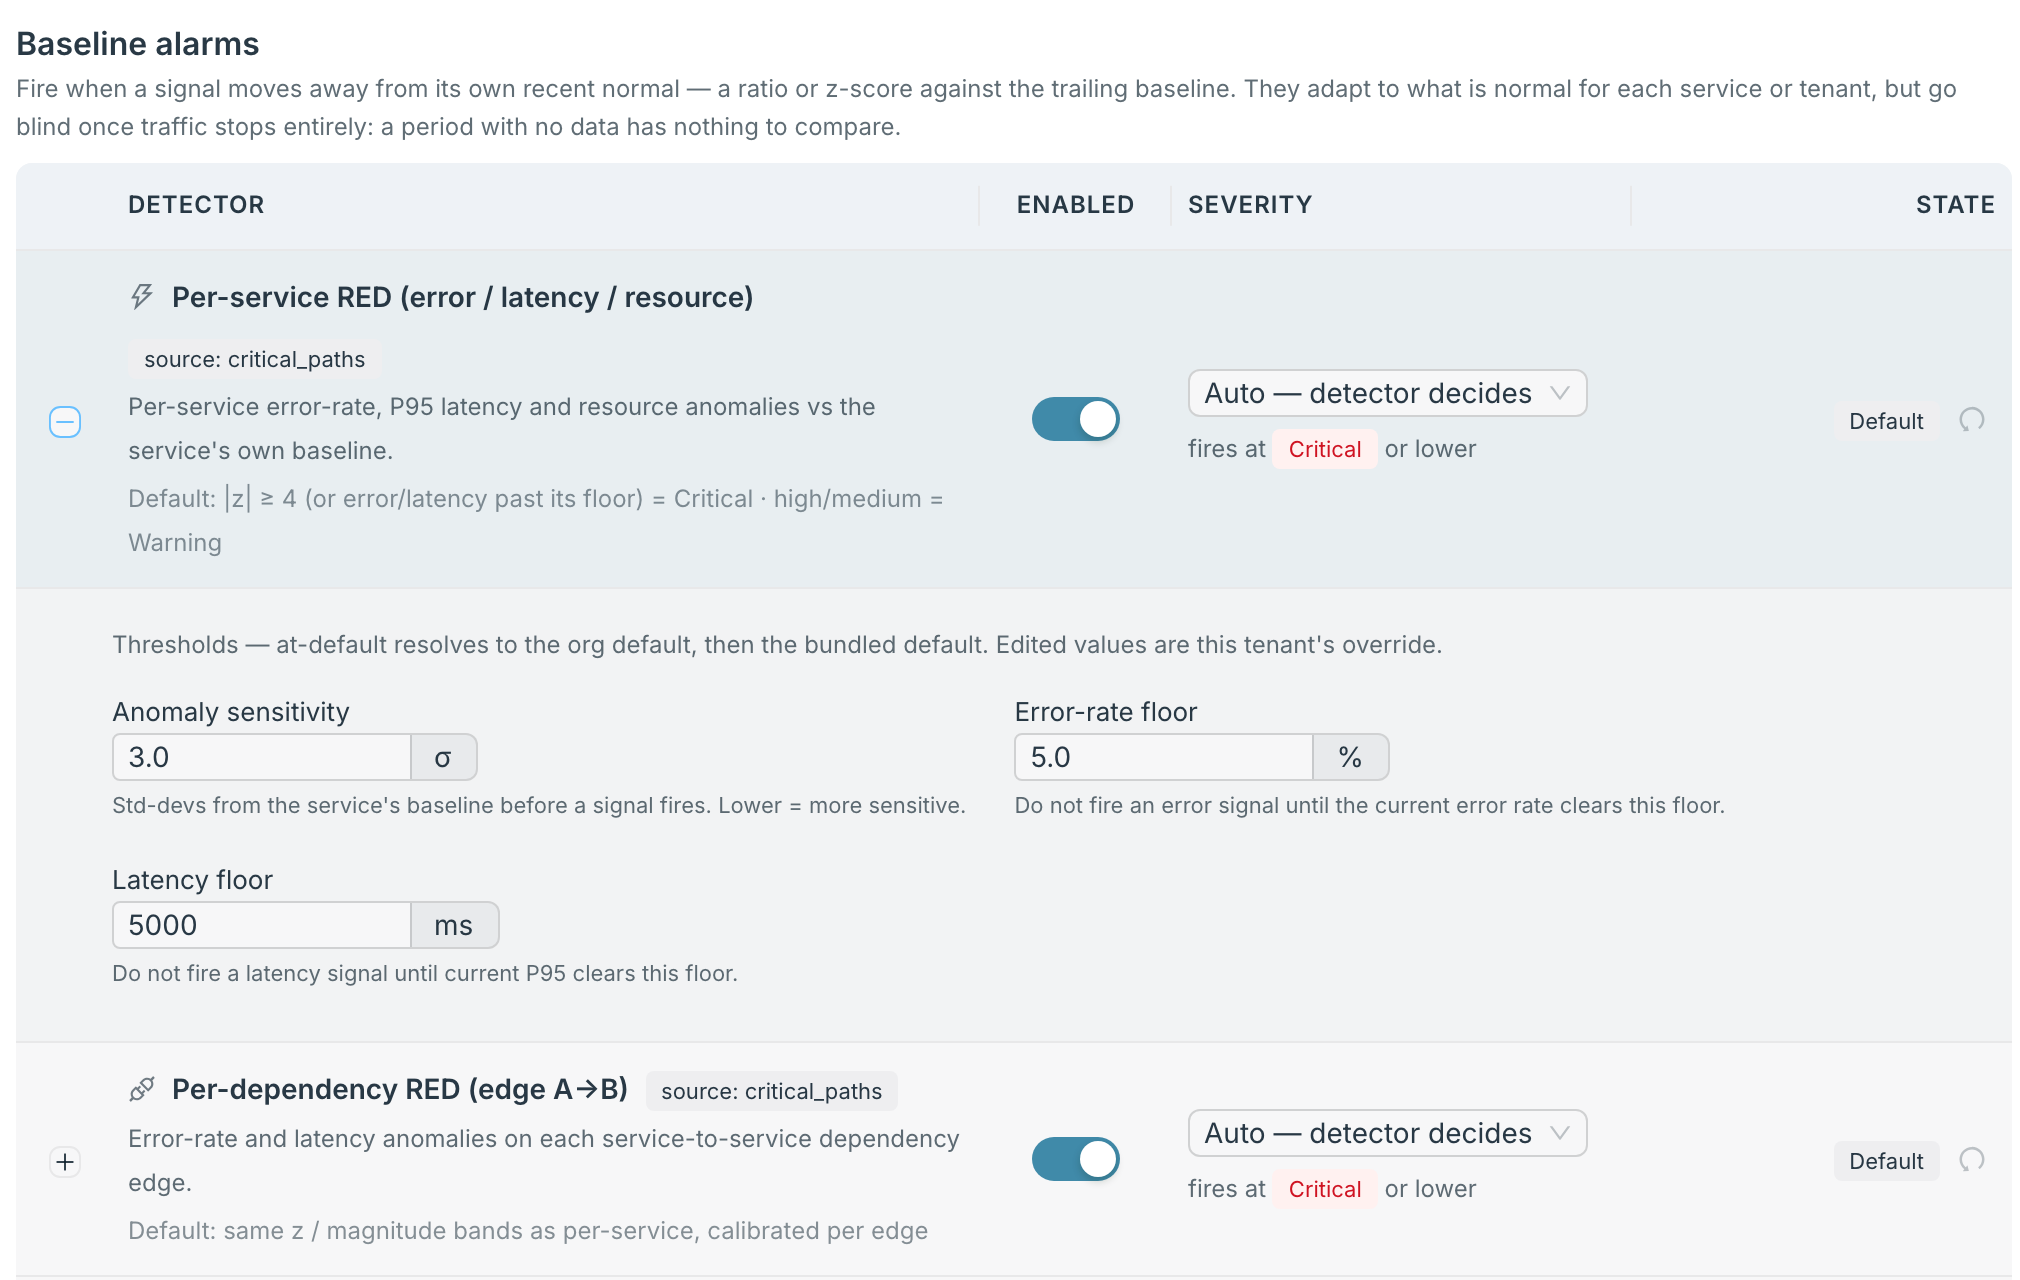
Each row gives you three controls:
| Control | What it does |
|---|---|
| Enabled | Turns the detector on or off. Off, it raises no incidents. |
| Severity | Auto — detector decides keeps the detector’s own level. At most Warning or At most Info caps a noisy detector without silencing it. Always Critical, Always Warning or Always Info pins it. The line underneath shows the level it will fire at. |
| State | Default or Custom. The reset button beside it puts a customised row back to the default. |
Expand a row for its thresholds, each with its unit and a line explaining it — for example Anomaly sensitivity, Error-rate floor and Latency floor on the RED detectors, and the drop and spike percentages on Traffic drop / spike. A threshold you’ve changed is tagged custom, with a link to reset it to its default.
There is no Save button: each change saves on its own, and a toast confirms it. One button in the card’s header reads All off while any detector is on, and turns them all off; once none are on it reads All on.
Below the table, Incident generation has one switch: Treat HTTP 4xx client responses as errors, on by default. It applies to spans that arrive after you change it.
Notifications — where it goes
Section titled “Notifications — where it goes”The Notifications page delivers each incident by email, by webhook, or both.
Incidents are emailed to the address you signed up with, with nothing to set up.
- Notification recipient sends alerts to a dedicated inbox instead, such as a shared monitoring alias. Enter the address and Save; that inbox gets a verification email, and nothing is sent to it until someone there presses Confirm this inbox. Until then the page shows the request as pending, with Resend. Clear returns alerts to your sign-up address.
- Severity filter chooses which incidents email you: Critical, Warning, Info, or any mix. It saves as you change it.
- Send test email sends a sample incident to the verified recipient, or to your sign-up address if none is set, so you can confirm delivery before you depend on it.
Webhooks
Section titled “Webhooks”Add Webhook sends incidents to an HTTP endpoint of your own.
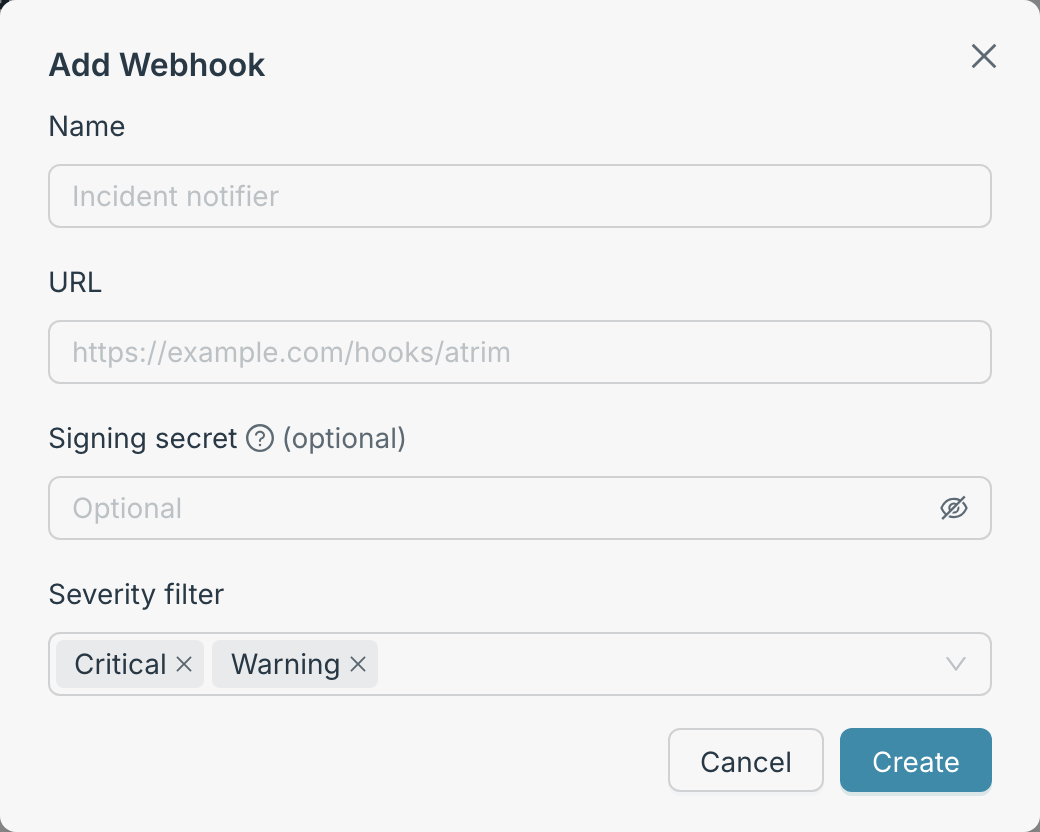
| Field | |
|---|---|
| Name | What the webhook is called in the list. |
| URL | Where incidents are sent. |
| Signing secret | Optional. When set, each delivery carries an HMAC-SHA256 signature in the X-Atrim-Signature header, so your endpoint can check it came from atrim.ai. |
| Severity filter | Which incidents this webhook receives: Critical, Warning, Info. New webhooks start with Critical and Warning. |
Each webhook in the list has an Active / Paused switch, and buttons to send a test delivery, edit it, or delete it. The test reports the HTTP status your endpoint returned, so you know it works before an incident depends on it.
See what was delivered
Section titled “See what was delivered”Every incident keeps its own delivery record. Open an incident on a wider screen than a phone and its Deliveries tab lists each email and webhook send — the channel, the target, whether it succeeded, how many attempts it took, when it was delivered, and any error. See Incidents.