Logs
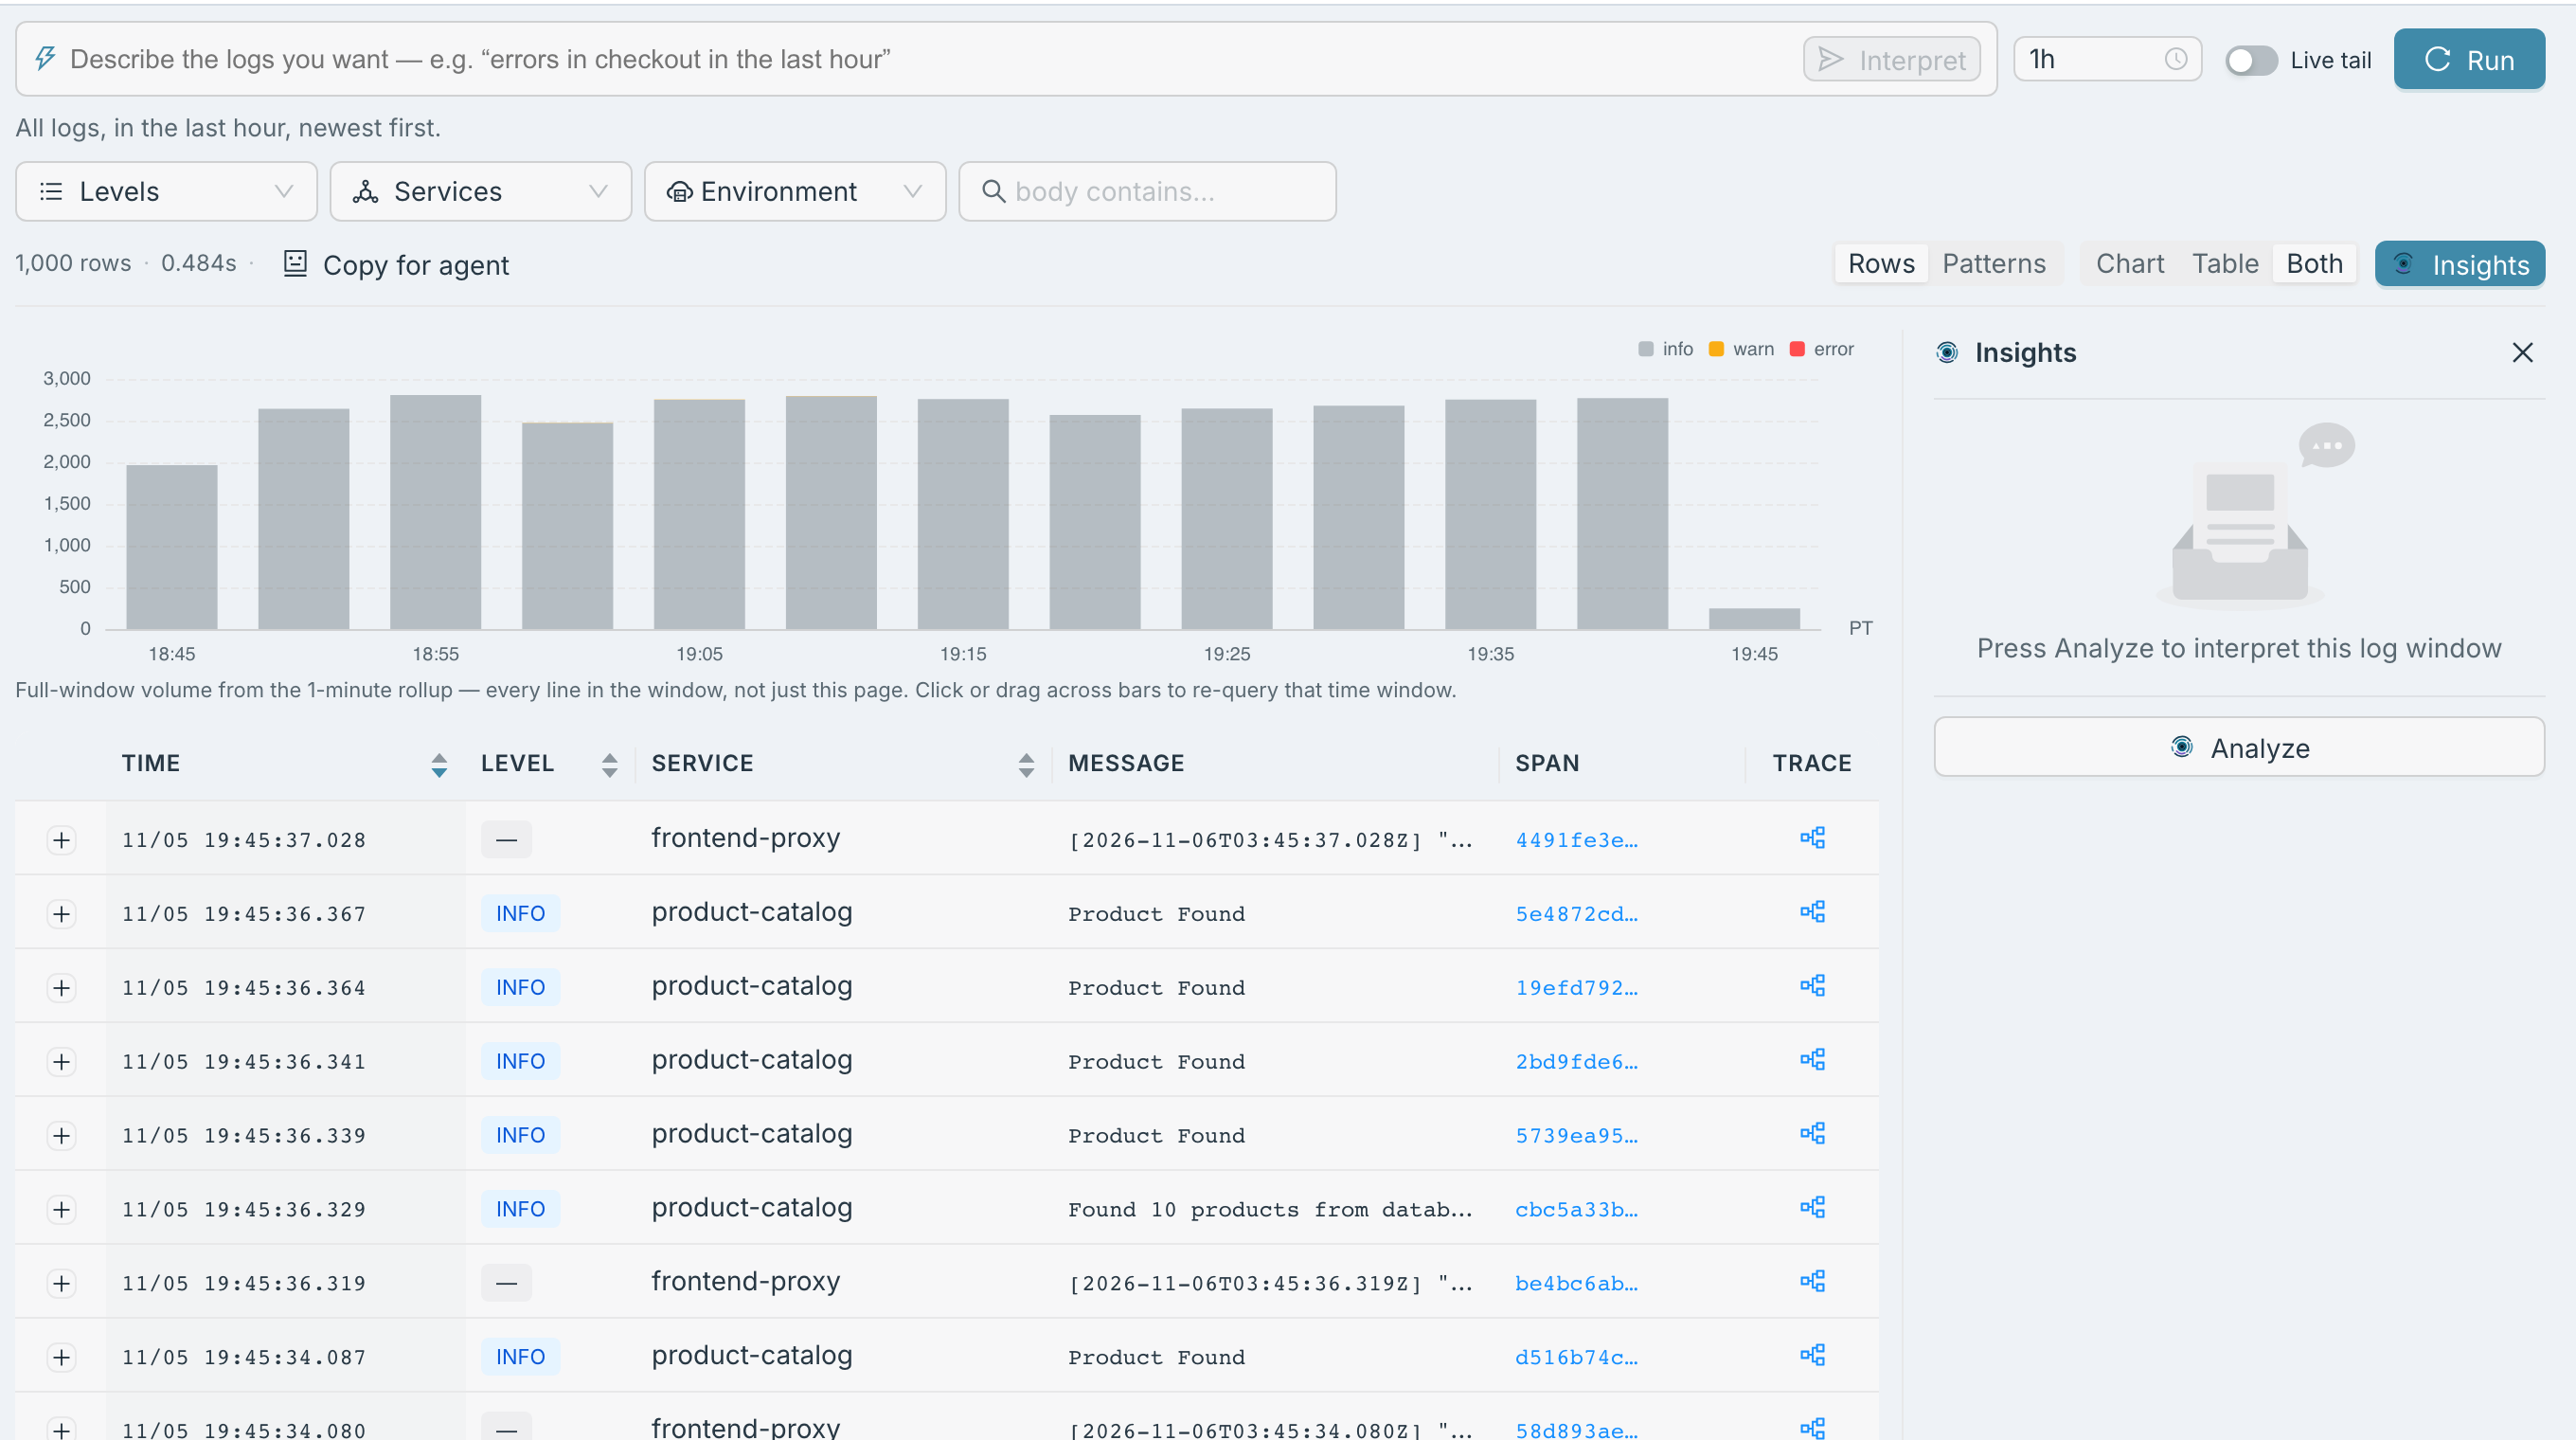
Open Logs and the last hour of your log lines is already on screen, newest first, with their volume charted above them. Narrow it with a sentence or a few filters, group it into patterns, or press Analyze and I’ll read the window and tell you what’s in it.
It lives under Exploration → Logs.
Ask, or filter
Section titled “Ask, or filter”Type what you want into the query bar — “errors in checkout in the last hour” — and press Interpret (or Enter). The filters it understood appear as pills and the query runs; a line under the bar says in plain words what ran. Set the window with the range control: a time in the question doesn’t change it. Ask in plain English covers how the bar reads your question.
The filters sit below the bar, always visible:
| Filter | What it does |
|---|---|
| Levels | Pick one or more of TRACE, DEBUG, INFO, WARN, ERROR and FATAL. |
| Services | Pick services; click a namespace heading to take all of its services at once. |
| Environment | Choose an environment you’ve sent, or type one. |
| body contains… | Keep the lines whose text contains what you type. |
Each filter you set shows as a pill you can remove with ×. Logs re-runs the moment you change a level, a service or the time range; text you type into Environment or body contains… applies when you press Enter or leave the field. The range offers 15m, 1h, 3h, 24h and 7d — 1h the first time, then the last range you picked in any explorer — and Run fetches the window again. If a query comes back empty because of your filters, Logs names each filter that emptied it, with how many lines you’d see without it and a Remove filter button.
Read the lines
Section titled “Read the lines”Rows lists the lines, 50 to a page: Time, Level, Service, Message, Span and Trace. Click a level or a service to filter by it. Expand a row and you get the whole body, the line’s timestamps and scope, its log attributes and its resource attributes; click any attribute value to add it as a filter.
The Span and Trace links open the request that wrote the line, with that span selected; the trace’s logs are in the panel below its waterfall. See Find in trace.
The chart counts lines by severity over the window. Click a bar, or drag across several, to narrow the query to that stretch of time; the window shows as a pill, and clicking the pill puts your previous range back. Chart / Table / Both picks what you see; Both is the default.
Group into patterns
Section titled “Group into patterns”Patterns folds the same window into templates, with the variable parts — numbers, ids, timestamps — replaced by placeholders. Each pattern shows its Count, its Severity mix, when it was first and last Seen, and a few example Traces you can open. View logs switches back to Rows filtered to that pattern’s text, so you can read the individual lines behind a count.
Live tail
Section titled “Live tail”Turn on Live tail and Rows refreshes every five seconds, so new lines arrive as your services write them. It follows Rows only; switching to Patterns stops it.
Let me read the window
Section titled “Let me read the window”The Insights rail on the right is open by default. Press Analyze and I read the lines in the current window, then lay out what I found: how many lines I scanned, how many were errors, the severity mix, a summary, the Likely causes, the patterns behind them, and Recommended actions.
Copy for agent, beside the row count, copies the window — a summary, sample lines and my analysis once you’ve run it — as text for your own coding agent.
Share a query
Section titled “Share a query”The filters ride in the page address, along with Rows or Patterns, so a refresh, the Back button or a link you send a teammate opens the same query.