Analyze
Press Analyze and I read the request for you. I walk every span in the trace, mark where its time and its errors went, and — when the request failed — name the service the failure started in, with the evidence beside it. You get a diagnosis to act on instead of a waterfall to decode.
Where you’ll find it
Section titled “Where you’ll find it”Analyze carries the atrim.ai eye wherever it appears; one click starts the analysis.
- On a trace. Open any trace and Analyze sits in its header, beside Copy for agent.
- On a critical path. Every path card in Critical Paths has Analyze under View Trace. It reads the path’s example traces, and View Trace in the panel opens the first of them.
- On an incident. The incident’s header has Analyze (in its ⋮ menu on a phone), which reads the traces the incident collected as evidence. The incident’s AI Analysis tab is its own view; see Incidents.
The analysis opens in a panel over the page you’re on, so the trace, path or incident you started from stays where you left it.
Watch it work
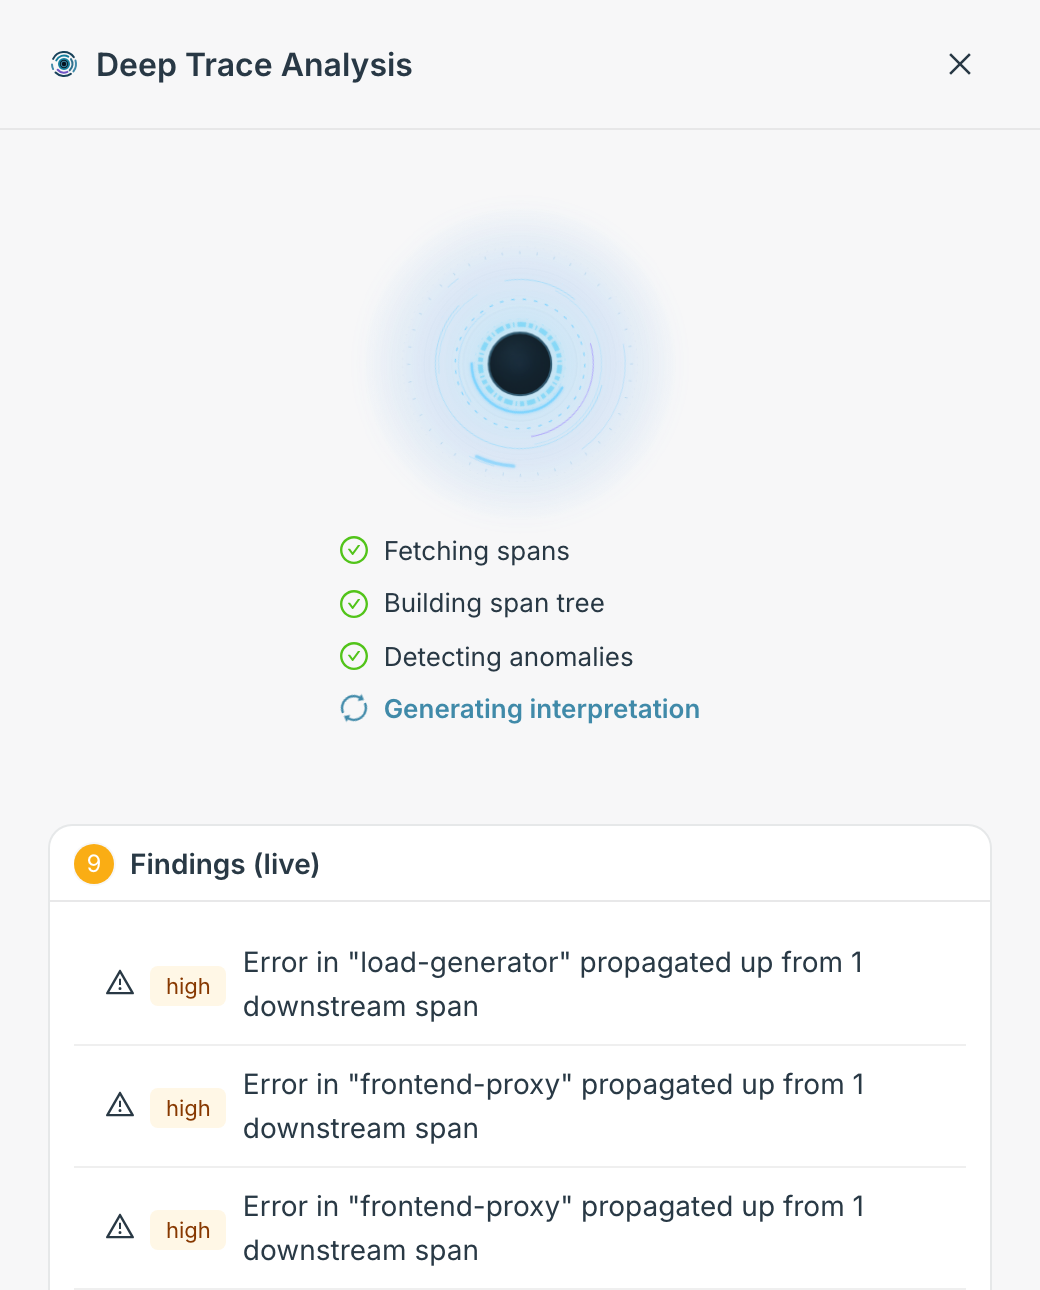
Section titled “Watch it work”Findings appear in a Findings (live) list the moment I make them, so you can start reading before I finish. Above them, each stage ticks off as it completes, from Fetching spans to Generating interpretation.
Read the result
Section titled “Read the result”Summary
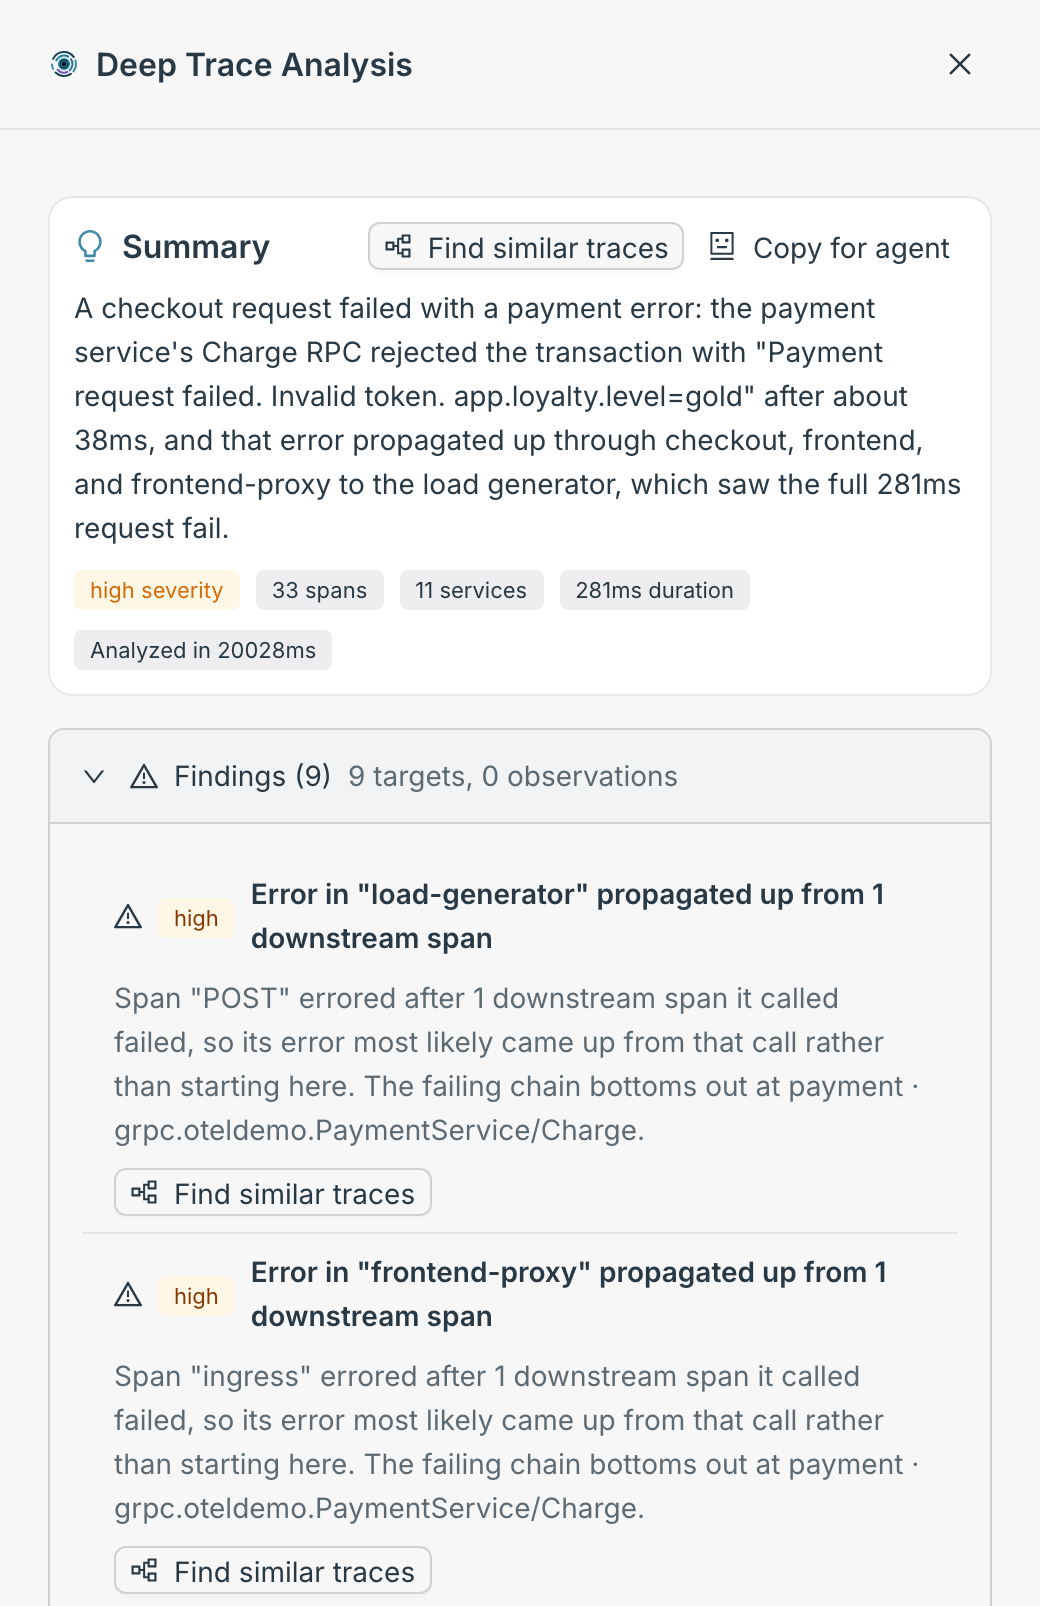
Section titled “Summary”The Summary card opens the result: a plain account of what happened to the request, with tags for the verdict, the span count, the number of services, the trace’s duration and how long the analysis took. The verdict is a severity — high severity, for example — when there is something to fix, and says so plainly when there isn’t: no anomalies, no optimization target when the findings are context rather than problems, or errored — no optimization target when the request failed but nothing in it is worth optimizing.
Findings — targets and observations
Section titled “Findings — targets and observations”Findings is collapsed under the summary, and its header tells you what’s inside before you open it — for example 9 targets, 0 observations.
- A target is something worth fixing. It carries a severity, coloured by how bad it is.
- An observation shows where time or errors went, as context. It wears a neutral tag and is never red.
Open the list and each finding gives its title, what I saw on which span and the measured values. Hover a finding’s tag to see the expectation it was judged against — one you declared, the root operation’s typical p95 over the past week, or a standard threshold.
When an error passes up through the services that called the one that failed, each caller’s span is its own finding, and each one points down to where the chain bottoms out — normally the service the Root Cause card names. On a trace that ran slow without failing, the findings show where the time went, ranked as targets and observations.
Recommendations
Section titled “Recommendations”Under the findings, Recommendations lists concrete next steps in order — on a failed checkout, for example, where to look in the payment service’s token validation and how to confirm which customers it affects.
Root cause and its evidence
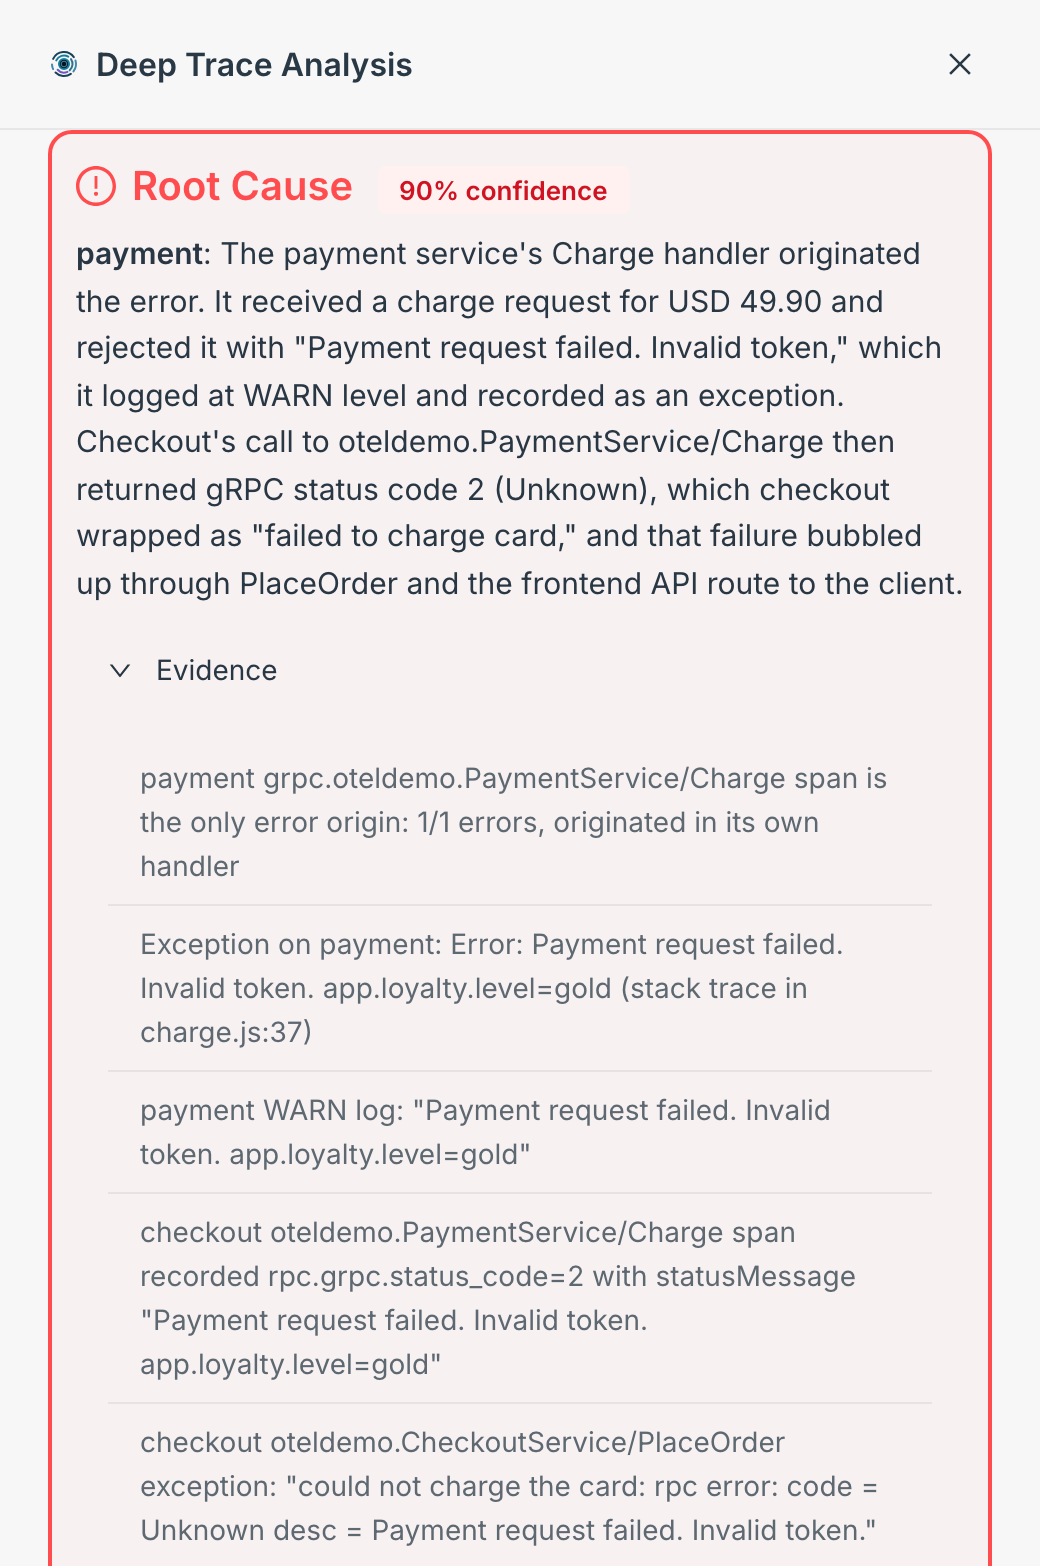
Section titled “Root cause and its evidence”When the request failed, the Root Cause card names the service the failure started in, says what went wrong there, and gives my confidence as a percentage. Open Evidence under it for the specifics I based that on: the span that originated the error, the exception it raised, the log line it wrote, and the path the error took up to the caller — each drawn from the trace and its logs.
Find similar traces
Section titled “Find similar traces”One trace is an example; the question is usually how many requests it stands for. Find similar traces on the Summary card, and on the findings that have one, opens Traces with a query for requests that share the pattern, already loaded and run. Hover the button to see what it will match before you click.
Hand it to your coding agent
Section titled “Hand it to your coding agent”Copy for agent on the Summary card copies the whole analysis — summary, findings, root cause, recommendations, the spans the findings name, and links back to similar traces — as markdown. Paste it into Claude Code, Cursor or any coding agent, and your agent starts from my diagnosis instead of a raw trace. Copy for agent shows what the paste contains and every other view that has the button.
Analyze on Logs and Metric Signals
Section titled “Analyze on Logs and Metric Signals”Two other surfaces have an Analyze of their own, scoped to what they show:
- In Logs, Analyze in the Insights rail reads the current log window and writes up what it finds.
- In Metric Signals, Analyze in the Finding panel explains a single concern and leaves its severity and rank exactly as they were.
Read-only, and sized to your plan
Section titled “Read-only, and sized to your plan”I read and explain — I never touch your systems. Analyze is a read of your telemetry: it changes nothing in your infrastructure, holds none of your credentials, and runs only when you press it.
How many analyses you can run in an hour — on a trace, a critical path or an incident — depends on your plan; each press of Analyze is one, however many traces it reads. If you reach that hour’s limit, Analyze pauses and tells you roughly when it’s available again. Copy for agent on the trace itself keeps working in the meantime, so you can carry on with your own agent. Settings → Usage shows how many AI investigations you’ve used this hour and this month — see Settings.