Copy for agent
Press Copy for agent and the view you’re looking at becomes text your coding agent can act on. It is written for a reader that has never seen atrim.ai: the evidence on screen, what I concluded from it, how to read both, and a concrete ask at the end. Paste it into Claude Code, Cursor or any other agent and it starts from the diagnosis. The copy stands on its own, so it works just as well handed to the team that owns the service.

Where you’ll find it
Section titled “Where you’ll find it”It is the same button on each view below — a small robot and the words Copy for agent — and it always copies the view it sits on. A confirmation names what you copied: Trace copied — paste into your agent.
| On | The button is | Your agent receives | And is asked |
|---|---|---|---|
| A trace | in the header, beside Analyze | the trace’s spans with their timing and attributes, its logs, and the spans whose own work took the longest | where the time went, and the three changes most worth making |
| An analysis | on the Summary card, beside Find similar traces | the summary, findings, root cause with its evidence, recommendations, the spans behind them, and links to similar traces | to confirm the diagnosis and propose the fix |
| Critical Paths | on the service map’s header | the ranked paths, in the order you see them, and the service map | which path deserves attention first, and what to look at next |
| Service Topology | on the map’s header, beside the time range | every service with its rate, error and latency figures, and the calls between services with their counts | which services or calls look unhealthy, and why |
| Trace Diff | on the Trace Diff tab of a service’s drawer or of a selected path’s Explore panel, at the top of the comparison | the two traces compared attribute by attribute, and the operations only one of them has | which differences explain the divergence, and which are noise |
| Metric Signals | in the Finding panel | the finding and the arithmetic behind its rank | what could explain it, and how to confirm or rule that out |
| An incident | at the top of the incident | the incident, the ids of its evidence traces with their time window, and the probable cause | to test the probable cause and name the next step |
| Traces, Logs and Metric Explorer | in the results bar, beside the result count | the summary of the window and sample rows — on Traces and Metric Explorer what stands out, on Logs my analysis once you have run it | the most likely cause, and what to check next |
| A metric in Metric Explorer | in the metric’s row, once you expand it | that metric’s figures, and the samples that left their source’s expected range | the most likely cause, and what to check next |
On a trace the button needs no analysis first: open the trace and copy. It never runs Analyze for you, on any view, so it uses none of your plan’s AI investigations.
What your agent receives
Section titled “What your agent receives”One block of markdown that opens and closes the same way on every view:
- A title naming the view it came from.
- How to read this — what the copy is and, wherever it carries structured data, what each section holds and how to read its key fields, so your agent isn’t left to guess what a name means.
- Context — the trace, the time window, the filters or the service the view was scoped to.
- The data. A trace, an analysis, an incident, the service map, the ranked paths and a trace comparison arrive as fenced blocks your agent can parse: a list as one record per line, a single record as one JSON document. Spans keep OpenTelemetry’s own field names, and anything computed for you — a span’s own time, a finding’s verdict — is marked as atrim.ai’s, so it is never mistaken for something your services reported. The explorers copy plain sample lines, and Metric Signals copies the finding’s figures as plain text. Large traces and long values are trimmed to a size an agent can take in, and the copy marks each cut.
- Findings, wherever the view had any, presented as hypotheses to check against the data.
- An ask — a specific question that fits the view, so the paste works on its own with nothing typed after it.
Here is the copy from the analysis walked below, cut down and re-wrapped to show its shape:
From a failed checkout to a fix
Section titled “From a failed checkout to a fix”A checkout request fails and the caller sees only a generic internal error. This is the whole path from that trace to a coding agent working on the cause.
-
Open the trace. From Critical Paths, View Trace on the checkout path opens an example of the failing request.
-
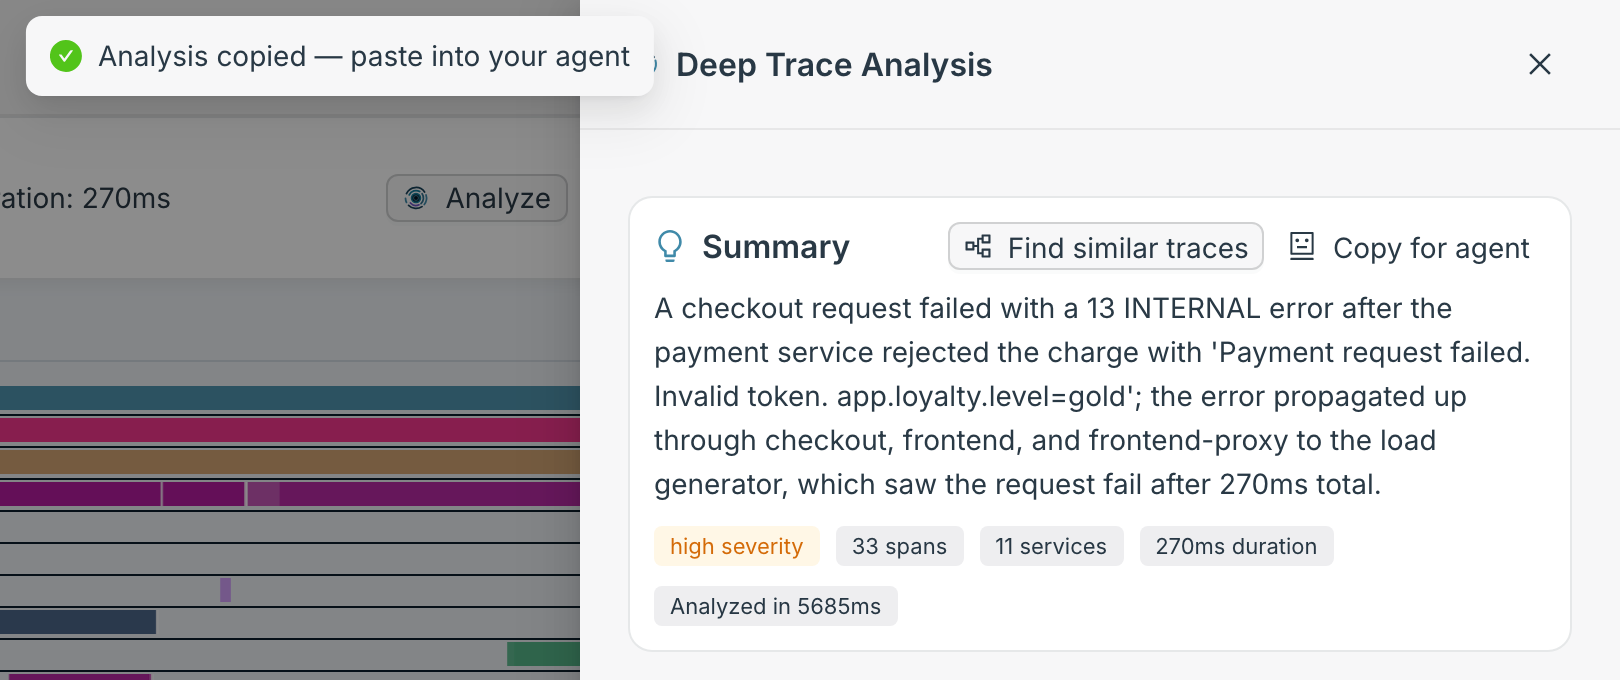
Press Analyze. I read all 33 spans and name the service the failure started in: payment, whose charge handler rejected the request with an invalid-token error that checkout, the frontend and the proxy only passed along.
-
Press Copy for agent on the Summary card. The confirmation reads Analysis copied — paste into your agent.
-
Paste it into your coding agent, in the payment service’s repository — or send it to the team that owns payment. The paste has the failing handler, the exception and the line that raised it (
charge.js:37), the warning the service logged, the route the error took to the caller, and my recommendations — with an ask to confirm the diagnosis and propose the change.
Diagnose a fault walks this failure and two others end to end, from the symptom you would notice to the cause worth fixing.
Keep the fix tied to the evidence
Section titled “Keep the fix tied to the evidence”An analysis copy and an incident copy carry a Fix provenance section just before the ask: a
few Atrim- lines that name what a fix would answer.
| Line | Names |
|---|---|
Atrim-Trace |
the trace, or traces, the diagnosis was read from |
Atrim-Incident |
the incident the diagnosis is linked to |
Atrim-Fingerprint |
that incident’s fingerprint — the recurring problem it stands for |
Atrim-Signature |
with no incident linked yet, the kind of problem: the service and the finding types, such as payment | error_propagation |
The ask tells your agent to put those lines, unchanged, in the issue and in the pull request description for the fix. When it does, a reviewer can look the cited trace up in atrim.ai, and a search of your issues and pull requests for a trace or incident id finds the change.
The ask also sets the bar for done. The trace is one example of a kind of failure, so your agent is told to verify against the kind, not the one trace: once the fix deploys, the incident should stop recurring and fresh traces of the same operation should no longer show the finding.
It goes to your clipboard, and nowhere else
Section titled “It goes to your clipboard, and nowhere else”I copy to your clipboard — I send nothing anywhere. Which agent reads it, and whether any does, is your call. The copy carries real span attributes and log lines from your services, so handle it as you would the telemetry itself. Its links back to atrim.ai open for anyone signed in to your workspace.