Diagnose a fault
Break something in the OTel Demo and I find it for you: the request path it hurts is at the top of Critical Paths, one press of Analyze names the service the failure started in, and Copy for agent gives you the whole diagnosis to paste into your coding agent. This page walks three real faults that way, from the symptom you would notice to the cause worth fixing.
The route every example takes
Section titled “The route every example takes”-
Turn the fault on in the demo’s flag page (
http://localhost:8080/feature) and leave it running. Each example says how soon to expect it. -
Open Critical Paths. I have already ranked the path the fault runs through first. Select it, and the services it crosses are listed above the detail panel; View full topology lights them on the map and dims the rest.
-
Press Analyze on that path. I read a handful of its example traces, the failing ones first, and lay out where their errors went.
-
Read the Root Cause card. It names the service the failure started in, what went wrong there and how confident I am, with the evidence under it.
-
Press Copy for agent on the analysis panel’s Summary card — the one that opens after Analyze — and paste the analysis into Claude Code, Cursor or any coding agent.
The same fault usually opens an incident in Incidents too, so it is waiting for you there even when you aren’t on Critical Paths.
When the symptom isn’t the cause — recommendationCacheFailure
Section titled “When the symptom isn’t the cause — recommendationCacheFailure”The symptom. Recommendations fail to load for a share of storefront requests, and the errors come back from product-catalog: it is answering requests with Product Not Found. Expect it on Critical Paths and in Incidents usually within about 7 minutes.
Critical Paths. A path through recommendation is ranked first, and recommendation is the highlighted hop in the selected path. The card below it, a shorter path through recommendation, shows errors on its recommendation → product-catalog hop.
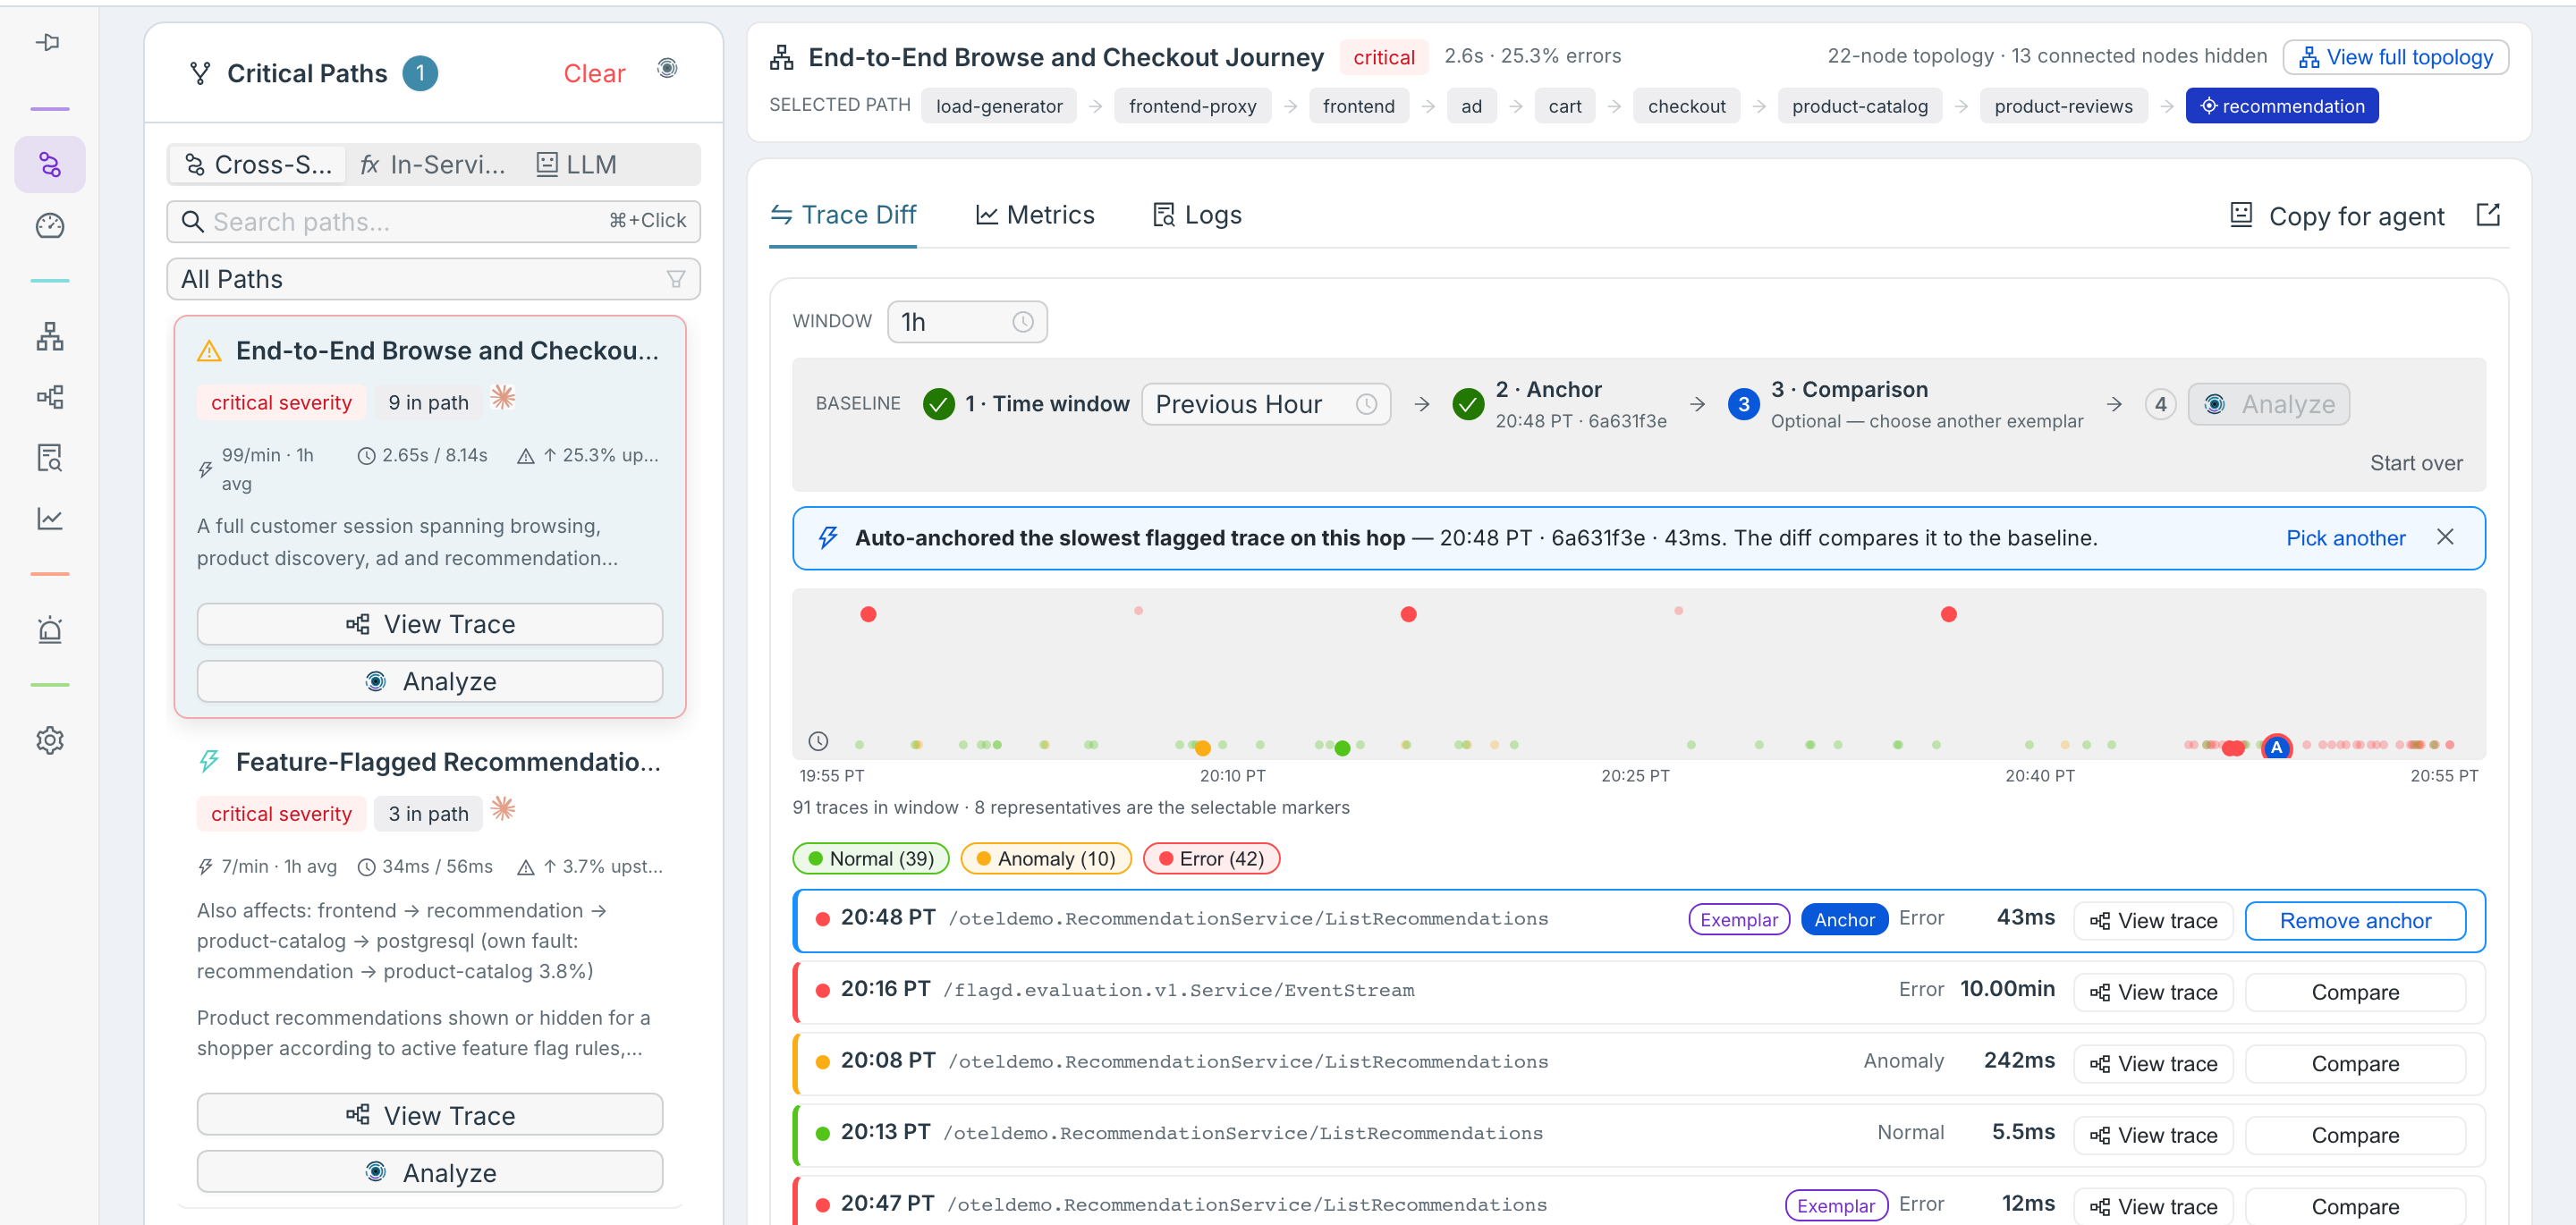
Analyze and the Root Cause card. Press Analyze on that path and I name recommendation. Product-catalog refused the request because of what recommendation sent it — a product lookup with no product id in it — so the fault is recommendation’s, not product-catalog’s. The evidence points at the file and line of the call that sent the empty request.
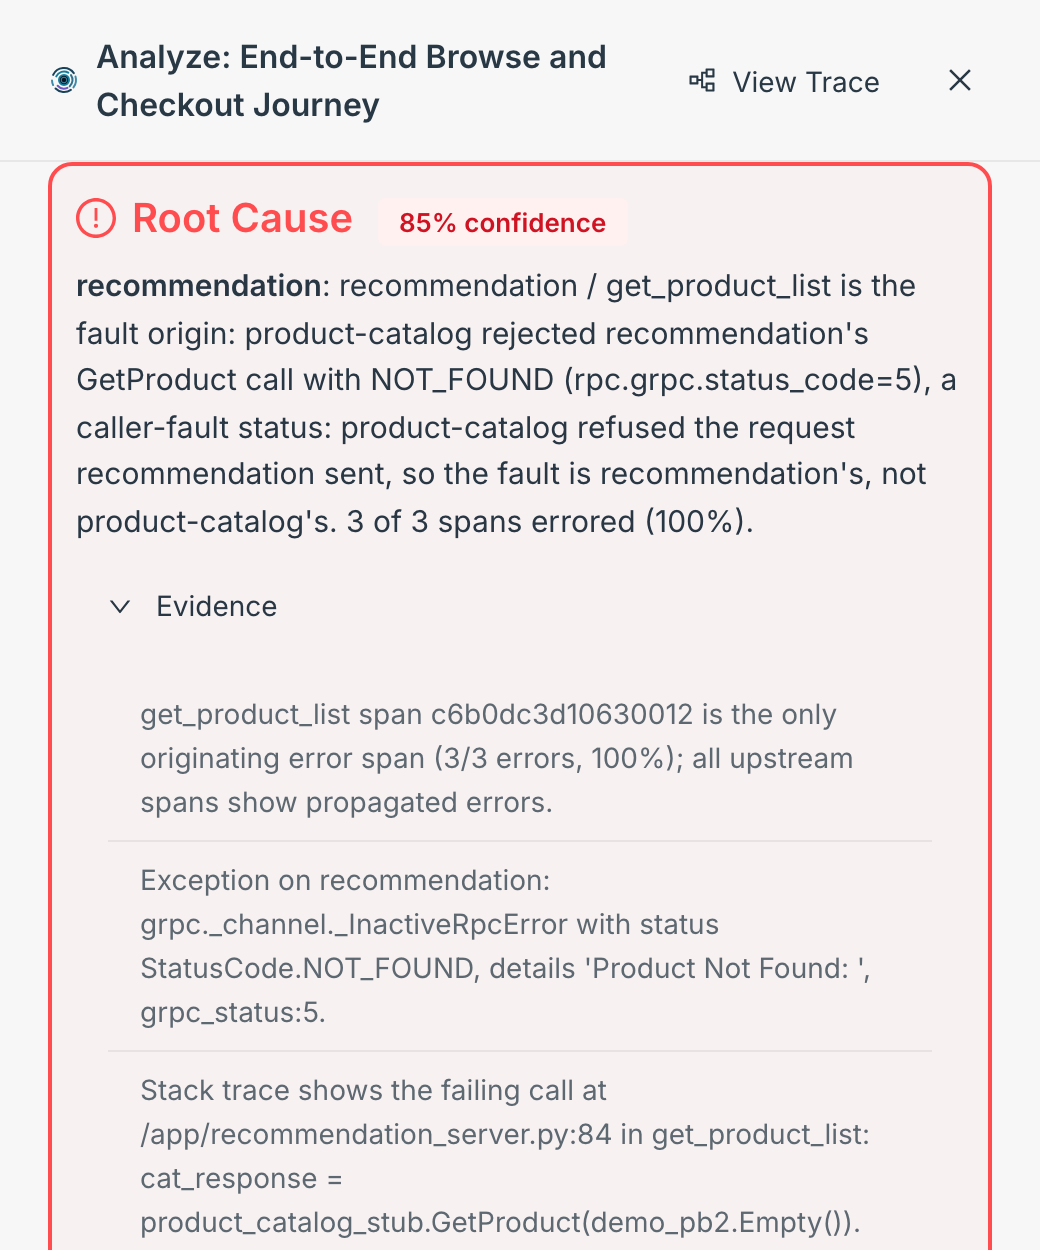
Product-catalog is healthy; the broken code is in recommendation, so that is where your fix goes.
Copy for agent on the Summary card gives your coding agent the whole analysis, including that stack-trace evidence. In Incidents, the same fault opens an incident on recommendation.
A failure that surfaces in a caller — paymentFailure
Section titled “A failure that surfaces in a caller — paymentFailure”The symptom. Some or all checkouts fail, depending on the percentage you pick for the flag. The shopper sees an error from the checkout page, and checkout, the frontend and the proxy in front of it all report the request as failed. Expect it on Critical Paths and in Incidents usually within about 8 minutes.
Critical Paths. The checkout payment path is ranked first, and payment is the highlighted hop in its selected path. Its trace list is the payment service’s Charge calls, with the failed ones marked.
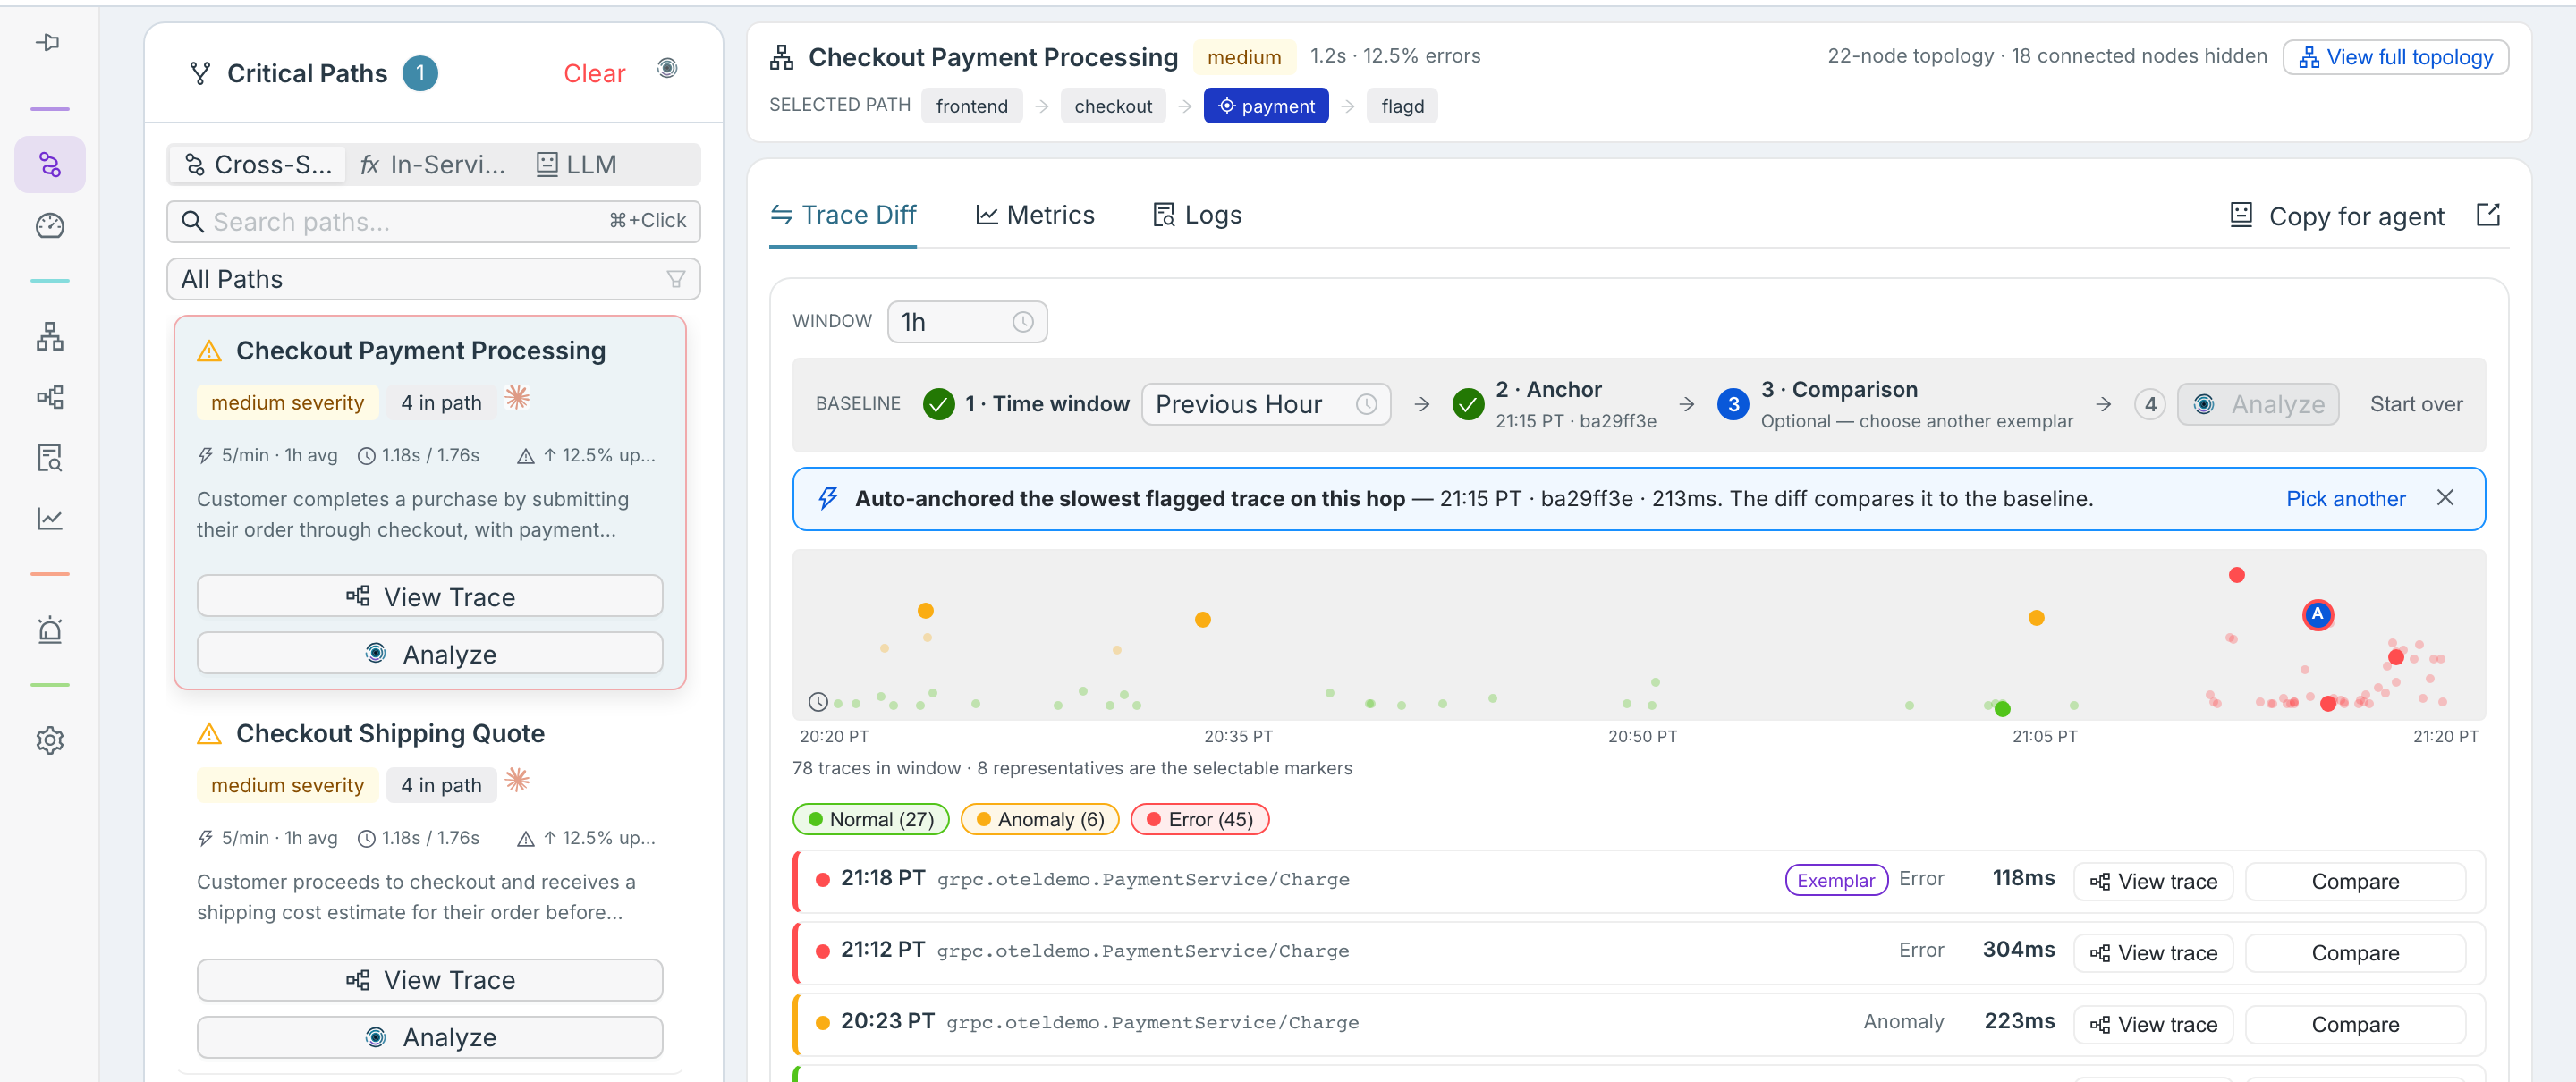
Analyze and the Root Cause card. The card names payment: its Charge handler rejected the charge and logged why, and every other service in the chain only passed that error back up. The evidence lists the exception payment raised, the warning it logged, and checkout reporting that it could not charge the card.
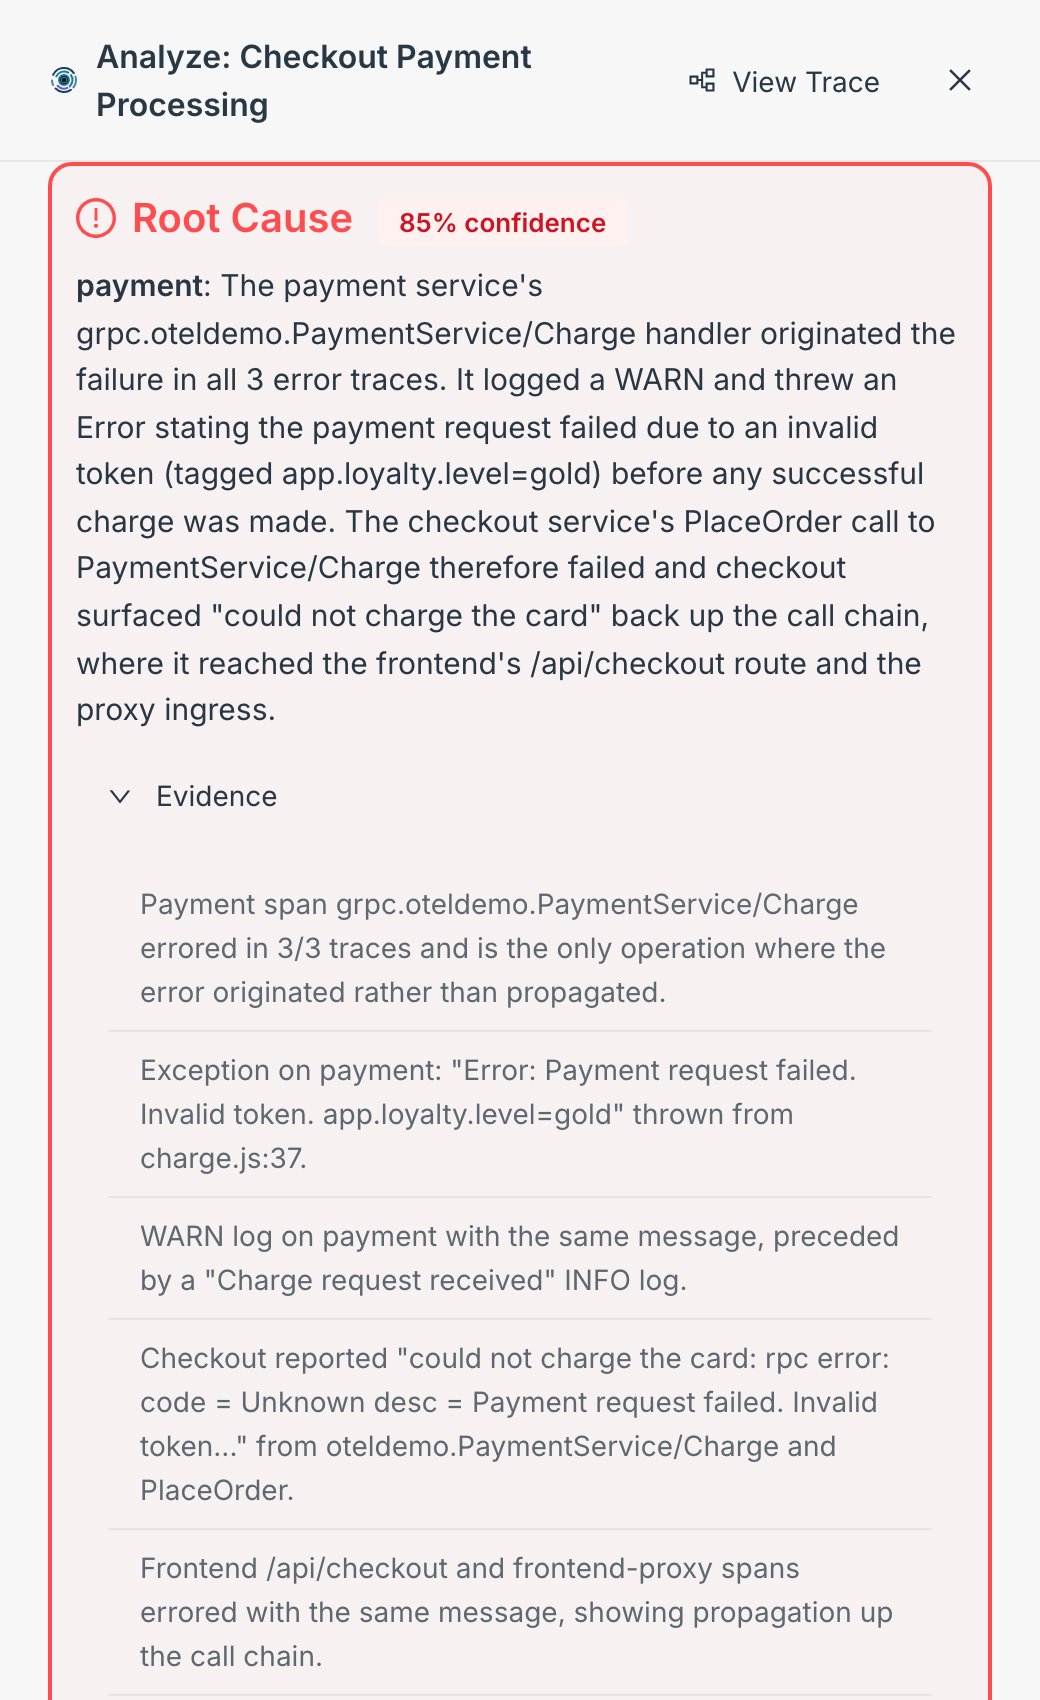
I separate the service that caused the failure from the ones that only passed it along, so you start in payment rather than in checkout, where the error first became visible.
Copy for agent sits on the Summary card, beside Find similar traces. It gives your coding agent the failing handler, the error it raised and the chain it travelled.
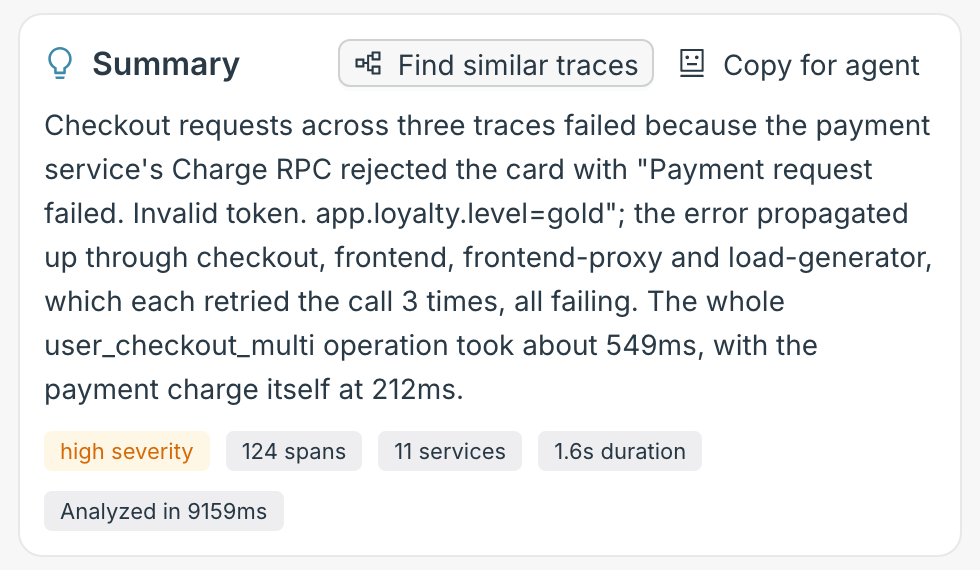
In Incidents, the same fault opens an incident on payment.
One operation out of three — cartFailure
Section titled “One operation out of three — cartFailure”The symptom. Errors show up in checkout, on its call to the cart service once an order is
placed. Shoppers can still add items and view their cart (AddItem and GetCart keep working);
what fails is emptying it (EmptyCart). Expect it on Critical Paths and in Incidents usually within
about 9 minutes.
Critical Paths. The checkout path that goes through the cart is ranked first, at critical severity, with cart the highlighted hop.
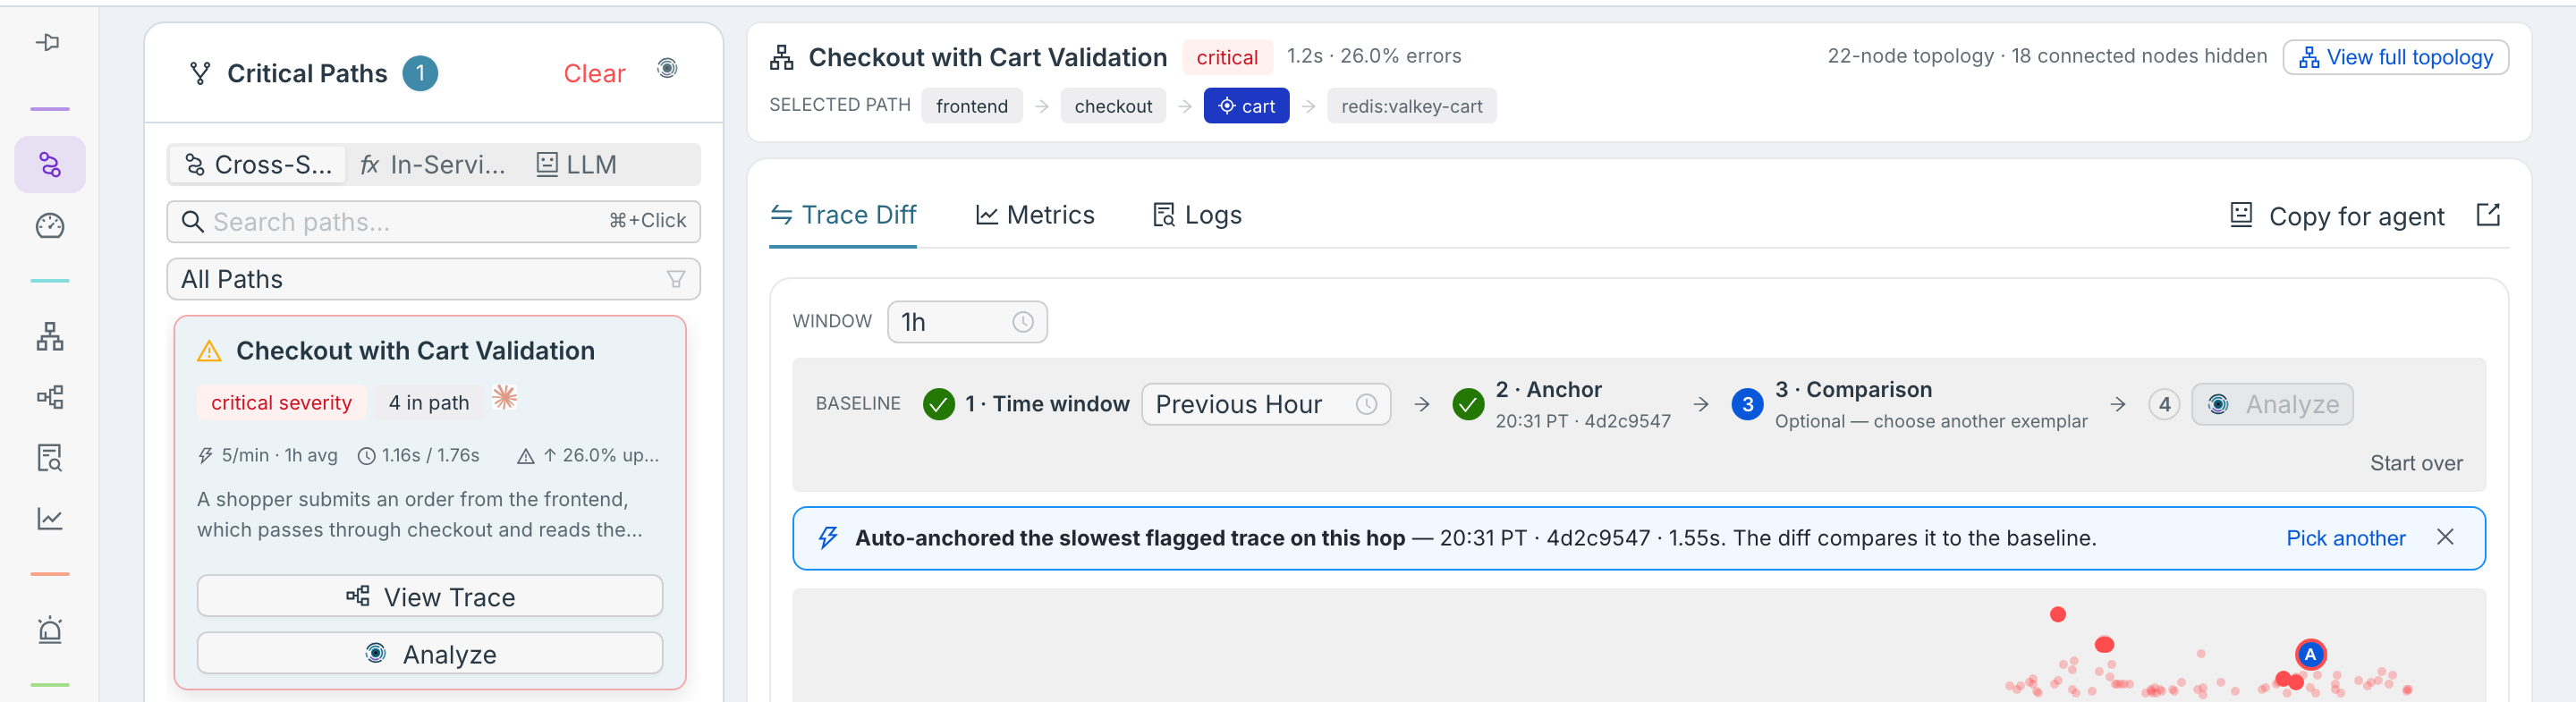
Analyze and the Root Cause card. The card names cart, and narrows it to one operation: the
EmptyCart handler failed in every trace, unable to reach its cart storage. Checkout’s call to
EmptyCart errored only because cart’s handler did, so checkout is not where it started.
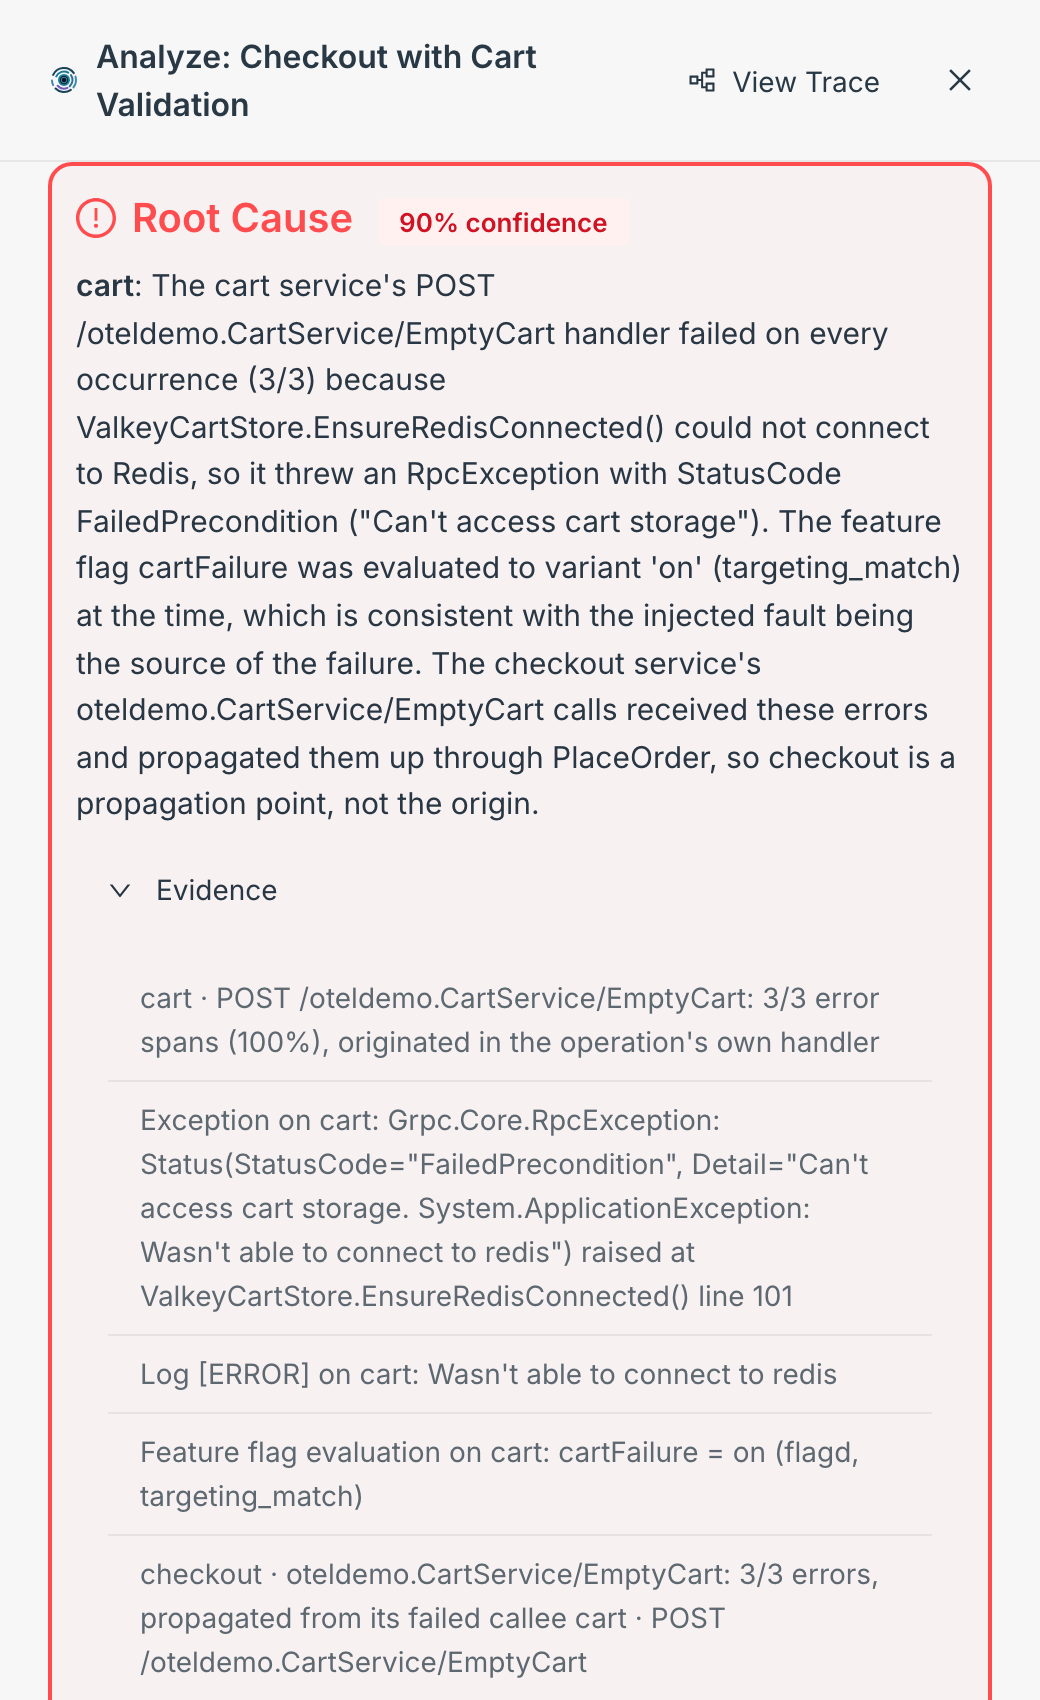
Because I narrow the fault to EmptyCart, your fix goes to that handler, not to the whole cart
service.
Copy for agent on the Summary card hands your coding agent the failing operation and the error behind it. In Incidents, the same fault opens an incident on cart.
On your own services
Section titled “On your own services”The same route works on any path in your own workspace, the moment your services send OpenTelemetry.