Find in trace
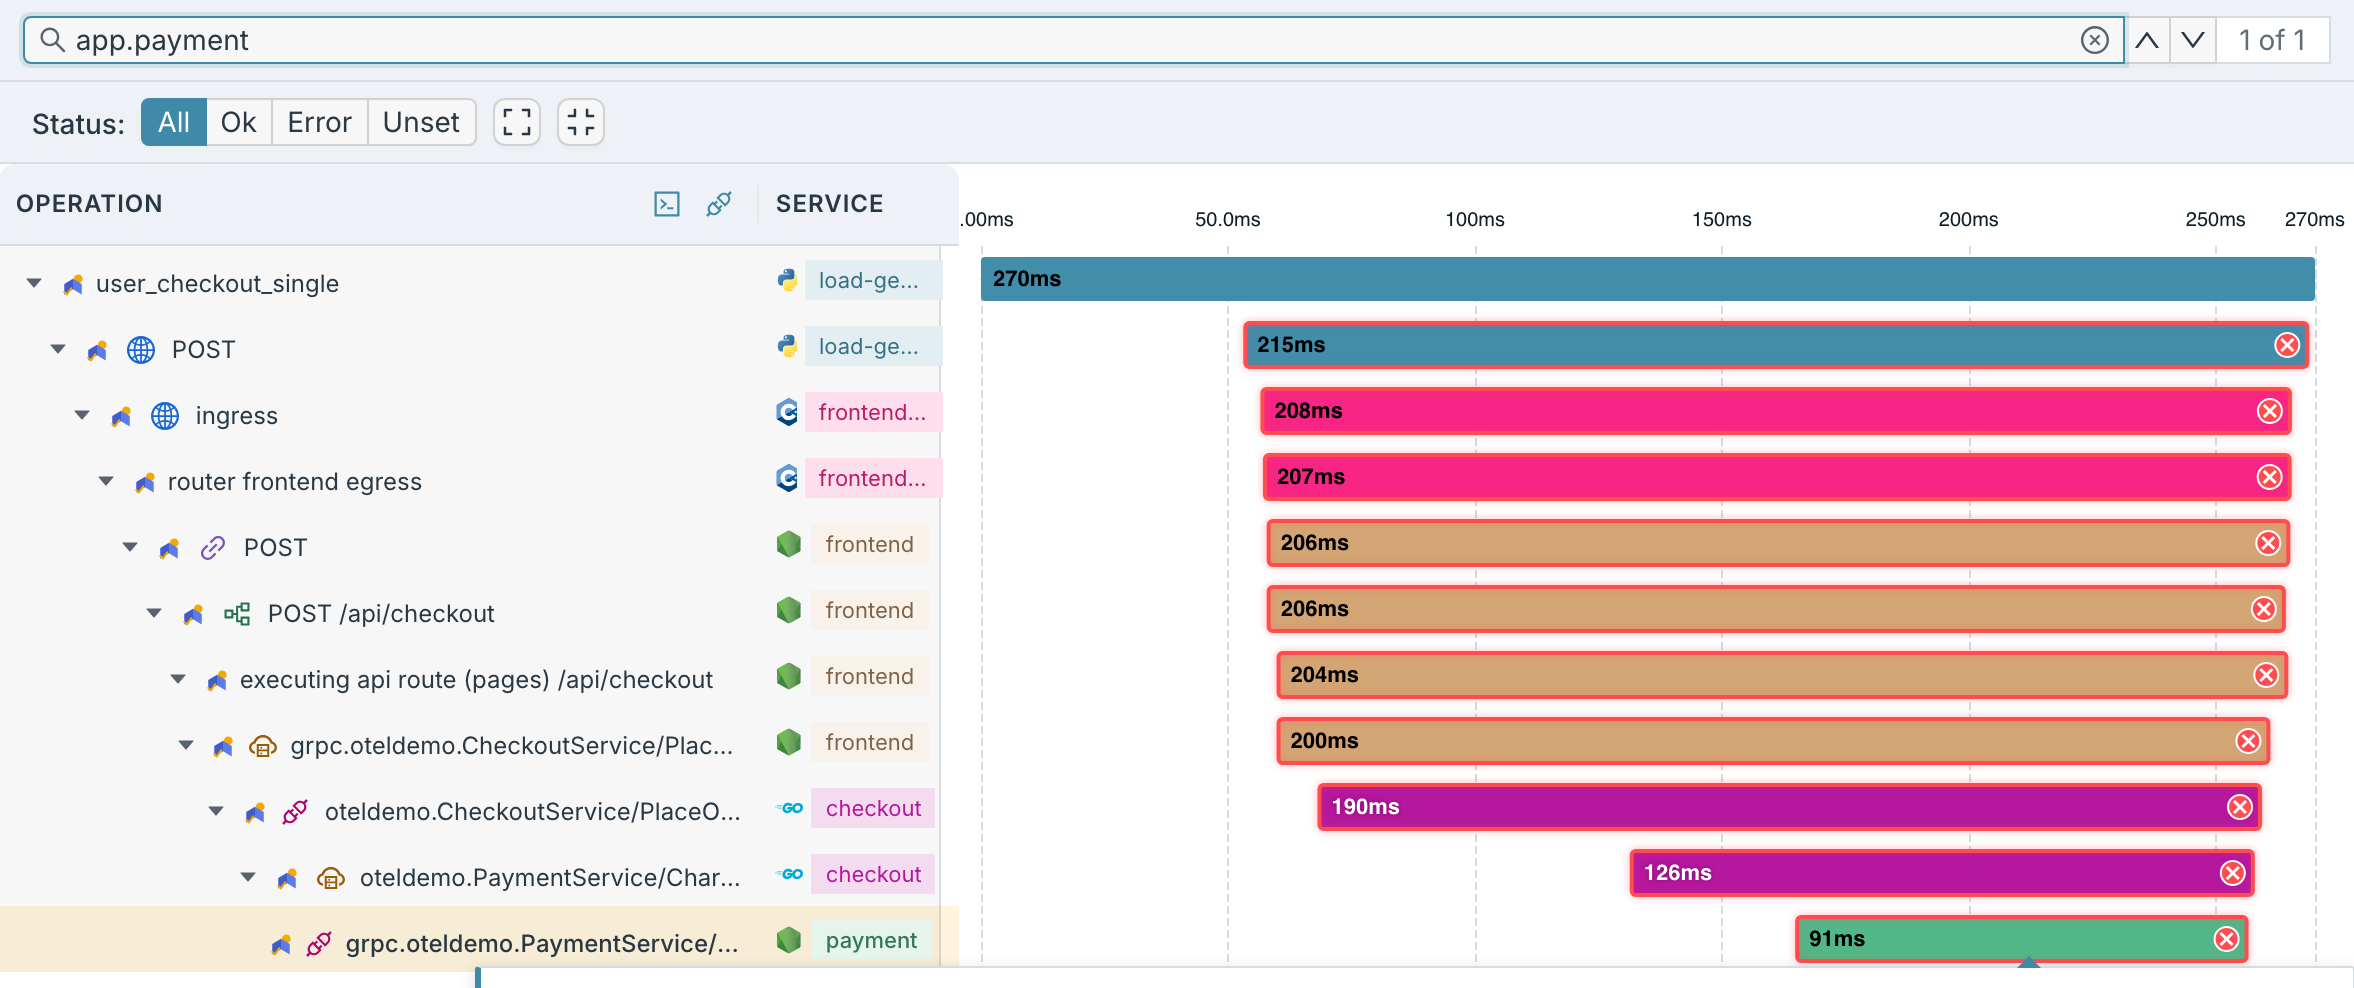
A checkout trace can run to hundreds of spans. Type what you’re after into Search spans and the trace narrows to the spans that match, with the path from the root down to each one kept, so you see where every match sits in the request.
Search spans
Section titled “Search spans”The search box sits above the span list in every trace you open. As you type, the span list and the waterfall narrow together to the matching spans and their parents. Clear the box, or press Esc inside it, and the whole trace comes back.
Type any part of what you’re looking for — no query syntax, and case doesn’t matter. A span matches when your text appears in:
- its service —
payment; - its operation —
PlaceOrder; - its span ID;
- one of its attributes — a key, a value, or both as
key:value, soapp.payment,Invalid tokenandrpc.method:Chargeall work.
Matched text in operation names is highlighted in the span list, and matching attributes are highlighted in the open span’s details.
Step through the matches
Section titled “Step through the matches”Beside the box, a counter reads N of M: M is the number of matching spans in the trace, and N is the one you’re on. Each span counts once, however many of its fields match. Press Enter for the next match and Shift+Enter for the previous one, or use the up and down arrows beside the box; both wrap around at the ends. The current match opens with its details, and any collapsed parents above it expand so it shows in the list. When nothing matches, the counter reads No matches and the whole trace stays in view.
Combine with the Status filter
Section titled “Combine with the Status filter”Status — All, Ok, Error or Unset — sits just below the search box and narrows
the trace on its own or together with a search. With both set, Status applies to what the search
left: you see the spans there that have that status, with their parents — search PaymentService
and pick Error to keep the failing calls to the payment service and the failing path above
them. The counter still counts every match in the trace, so it can read higher than the matches in
view; pick All to bring the rest back.
Find in this trace
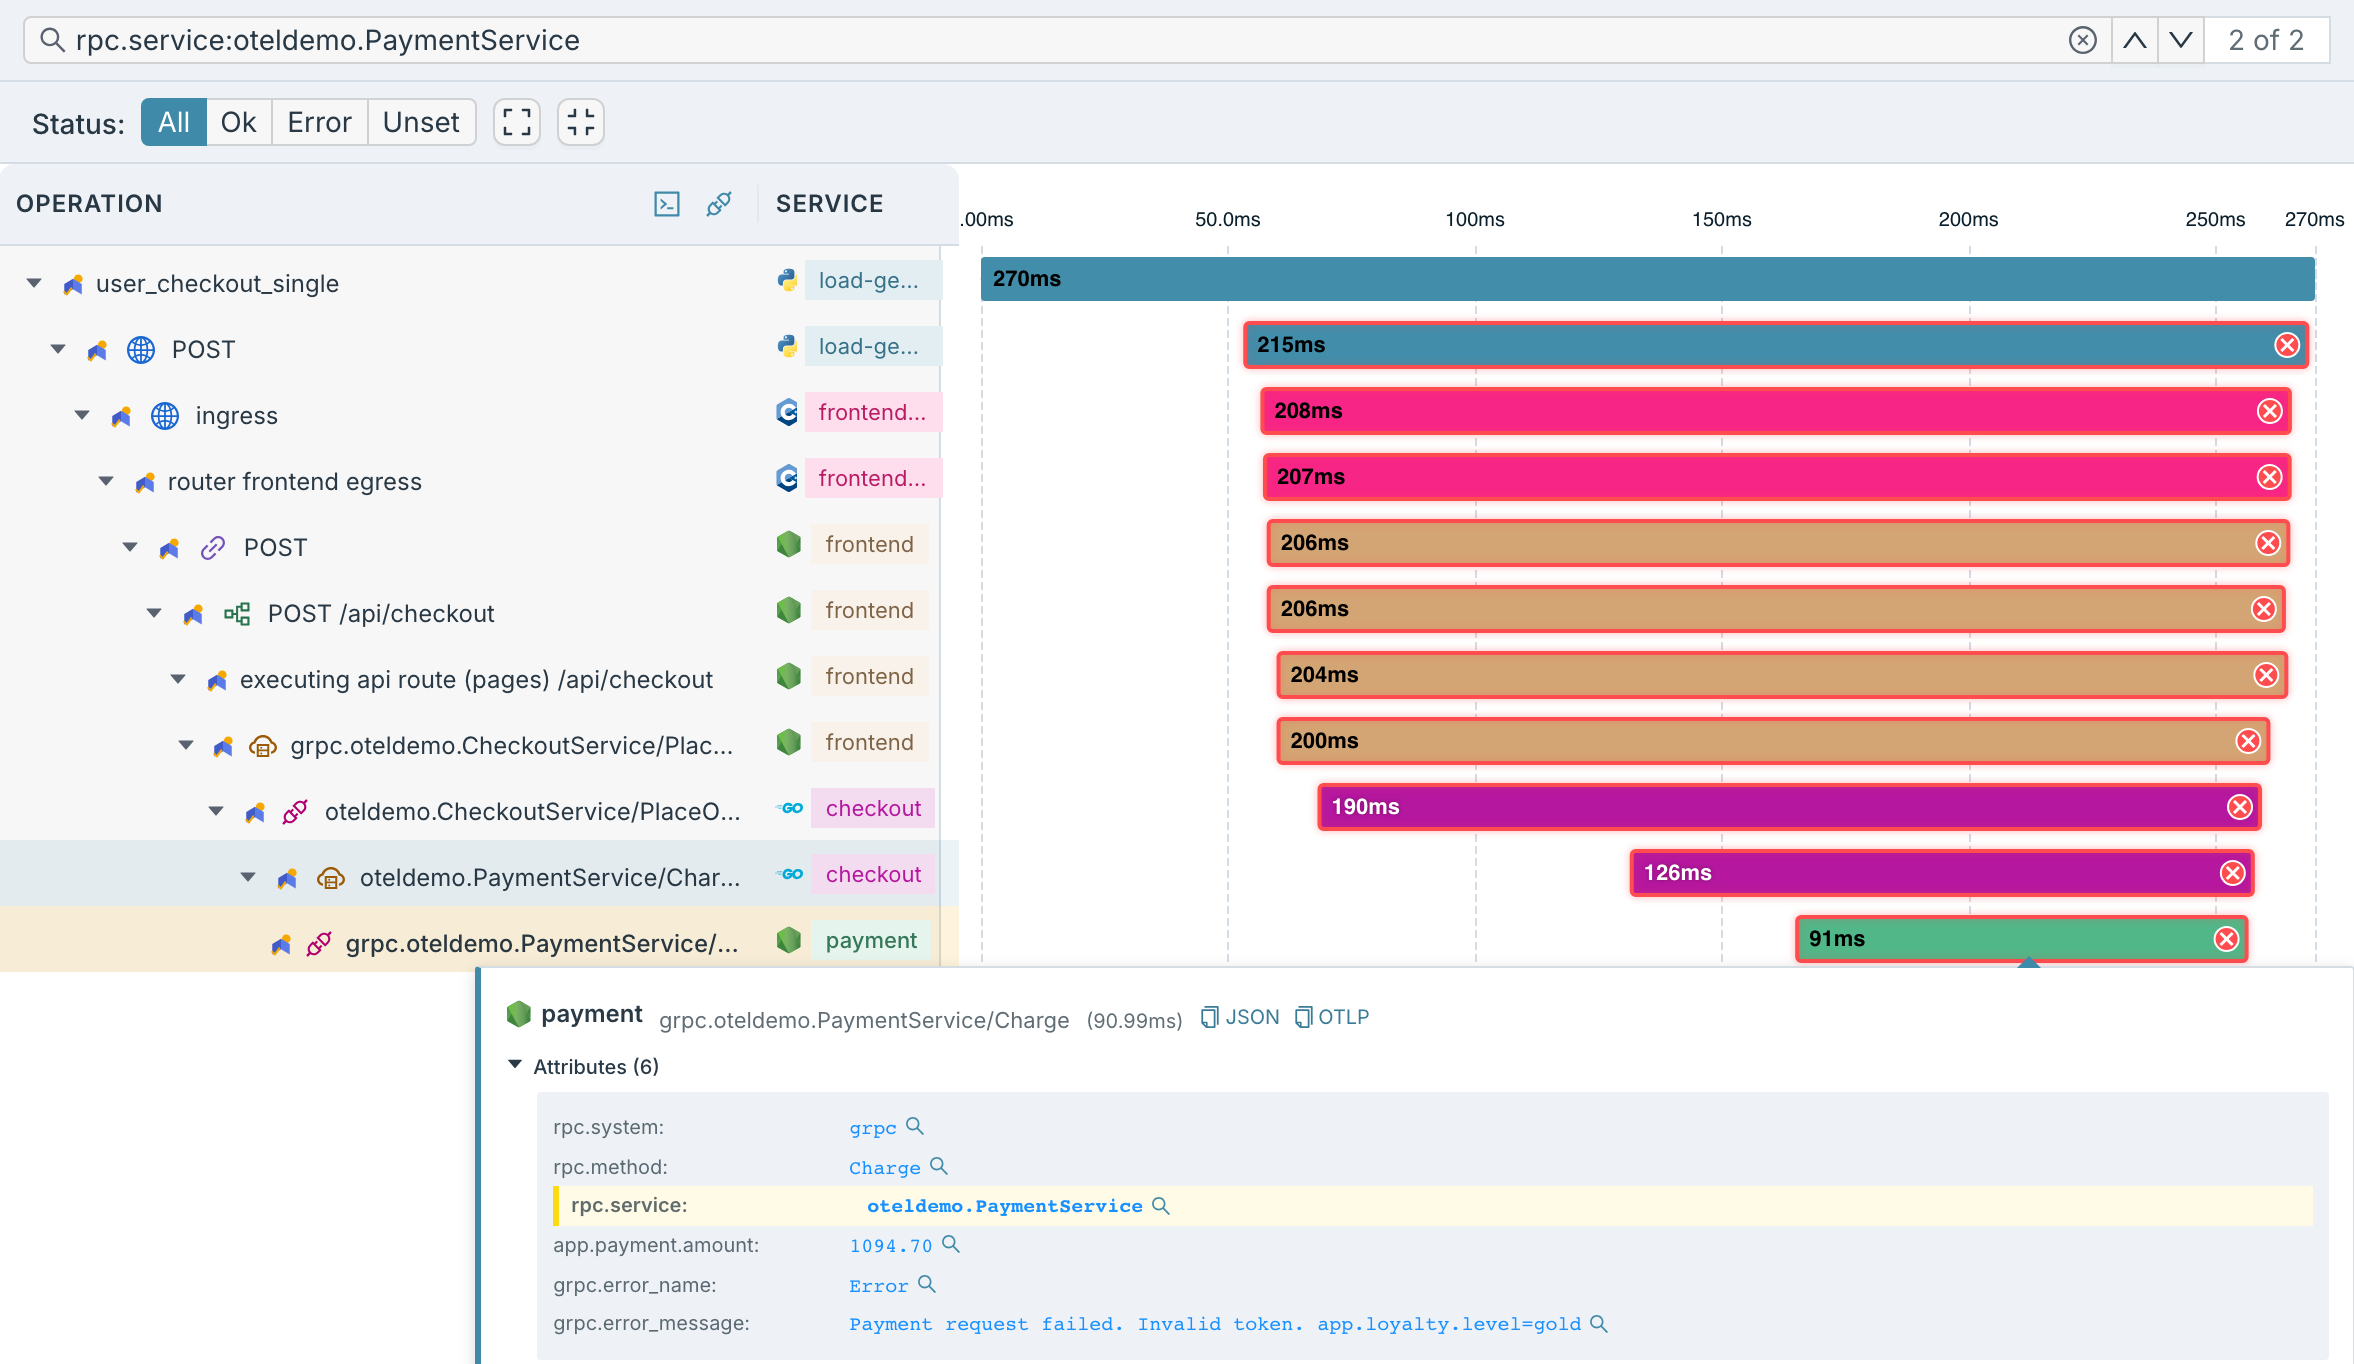
Section titled “Find in this trace”Or skip the typing. Open a span, expand its Attributes, and each value has a magnifier beside
it: Find in this trace. Click it and the search box fills with that attribute as key:value,
the trace narrows to every span with an attribute containing it, and you stay on the span you
started from — the counter shows where it falls among the matches.
Read the span you landed on
Section titled “Read the span you landed on”The match you stop on opens with everything the span recorded. Under its attributes, Events lists what happened inside the span and when; open Events and an exception shows its message, with the stack trace a click away. The footer counts the span’s events and its logs.

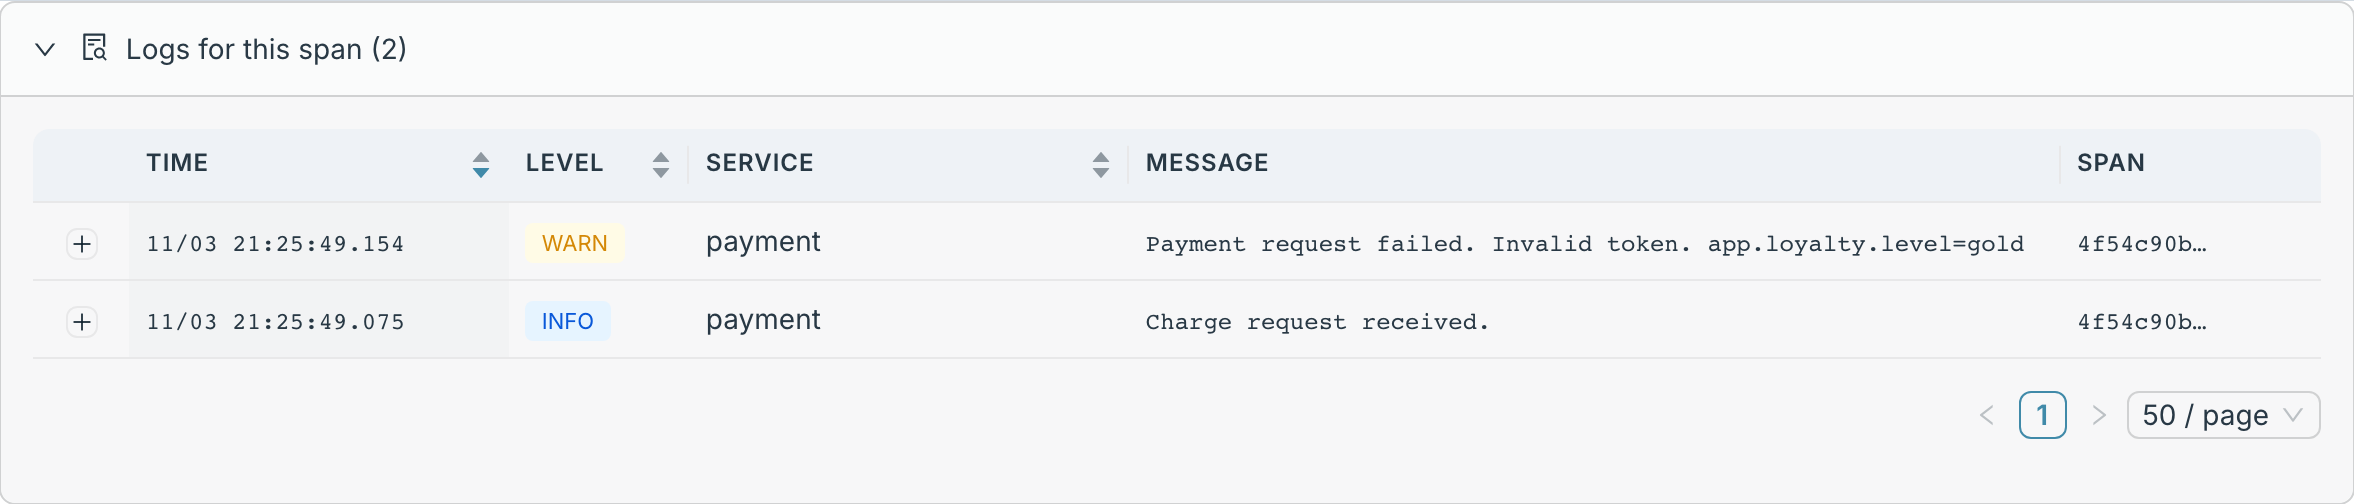
Click the logs count and Logs for this span opens beneath the waterfall with the lines written under that span, newest first, each with its level. Before you pick a span, the same panel at the bottom of the trace reads Logs for this trace and lists the log lines from the whole request.
From one trace to all your traces
Section titled “From one trace to all your traces”The Find in this trace magnifier searches this trace; the attribute’s value itself takes you out of it. Click the value and the trace closes, and Traces adds that attribute and value to its current query as a filter and runs it, so you see the other traces with a span that carries it. Hover the value first to see the filter it will add. From an analysis, Find similar traces does the same for a whole pattern.