Metric Explorer
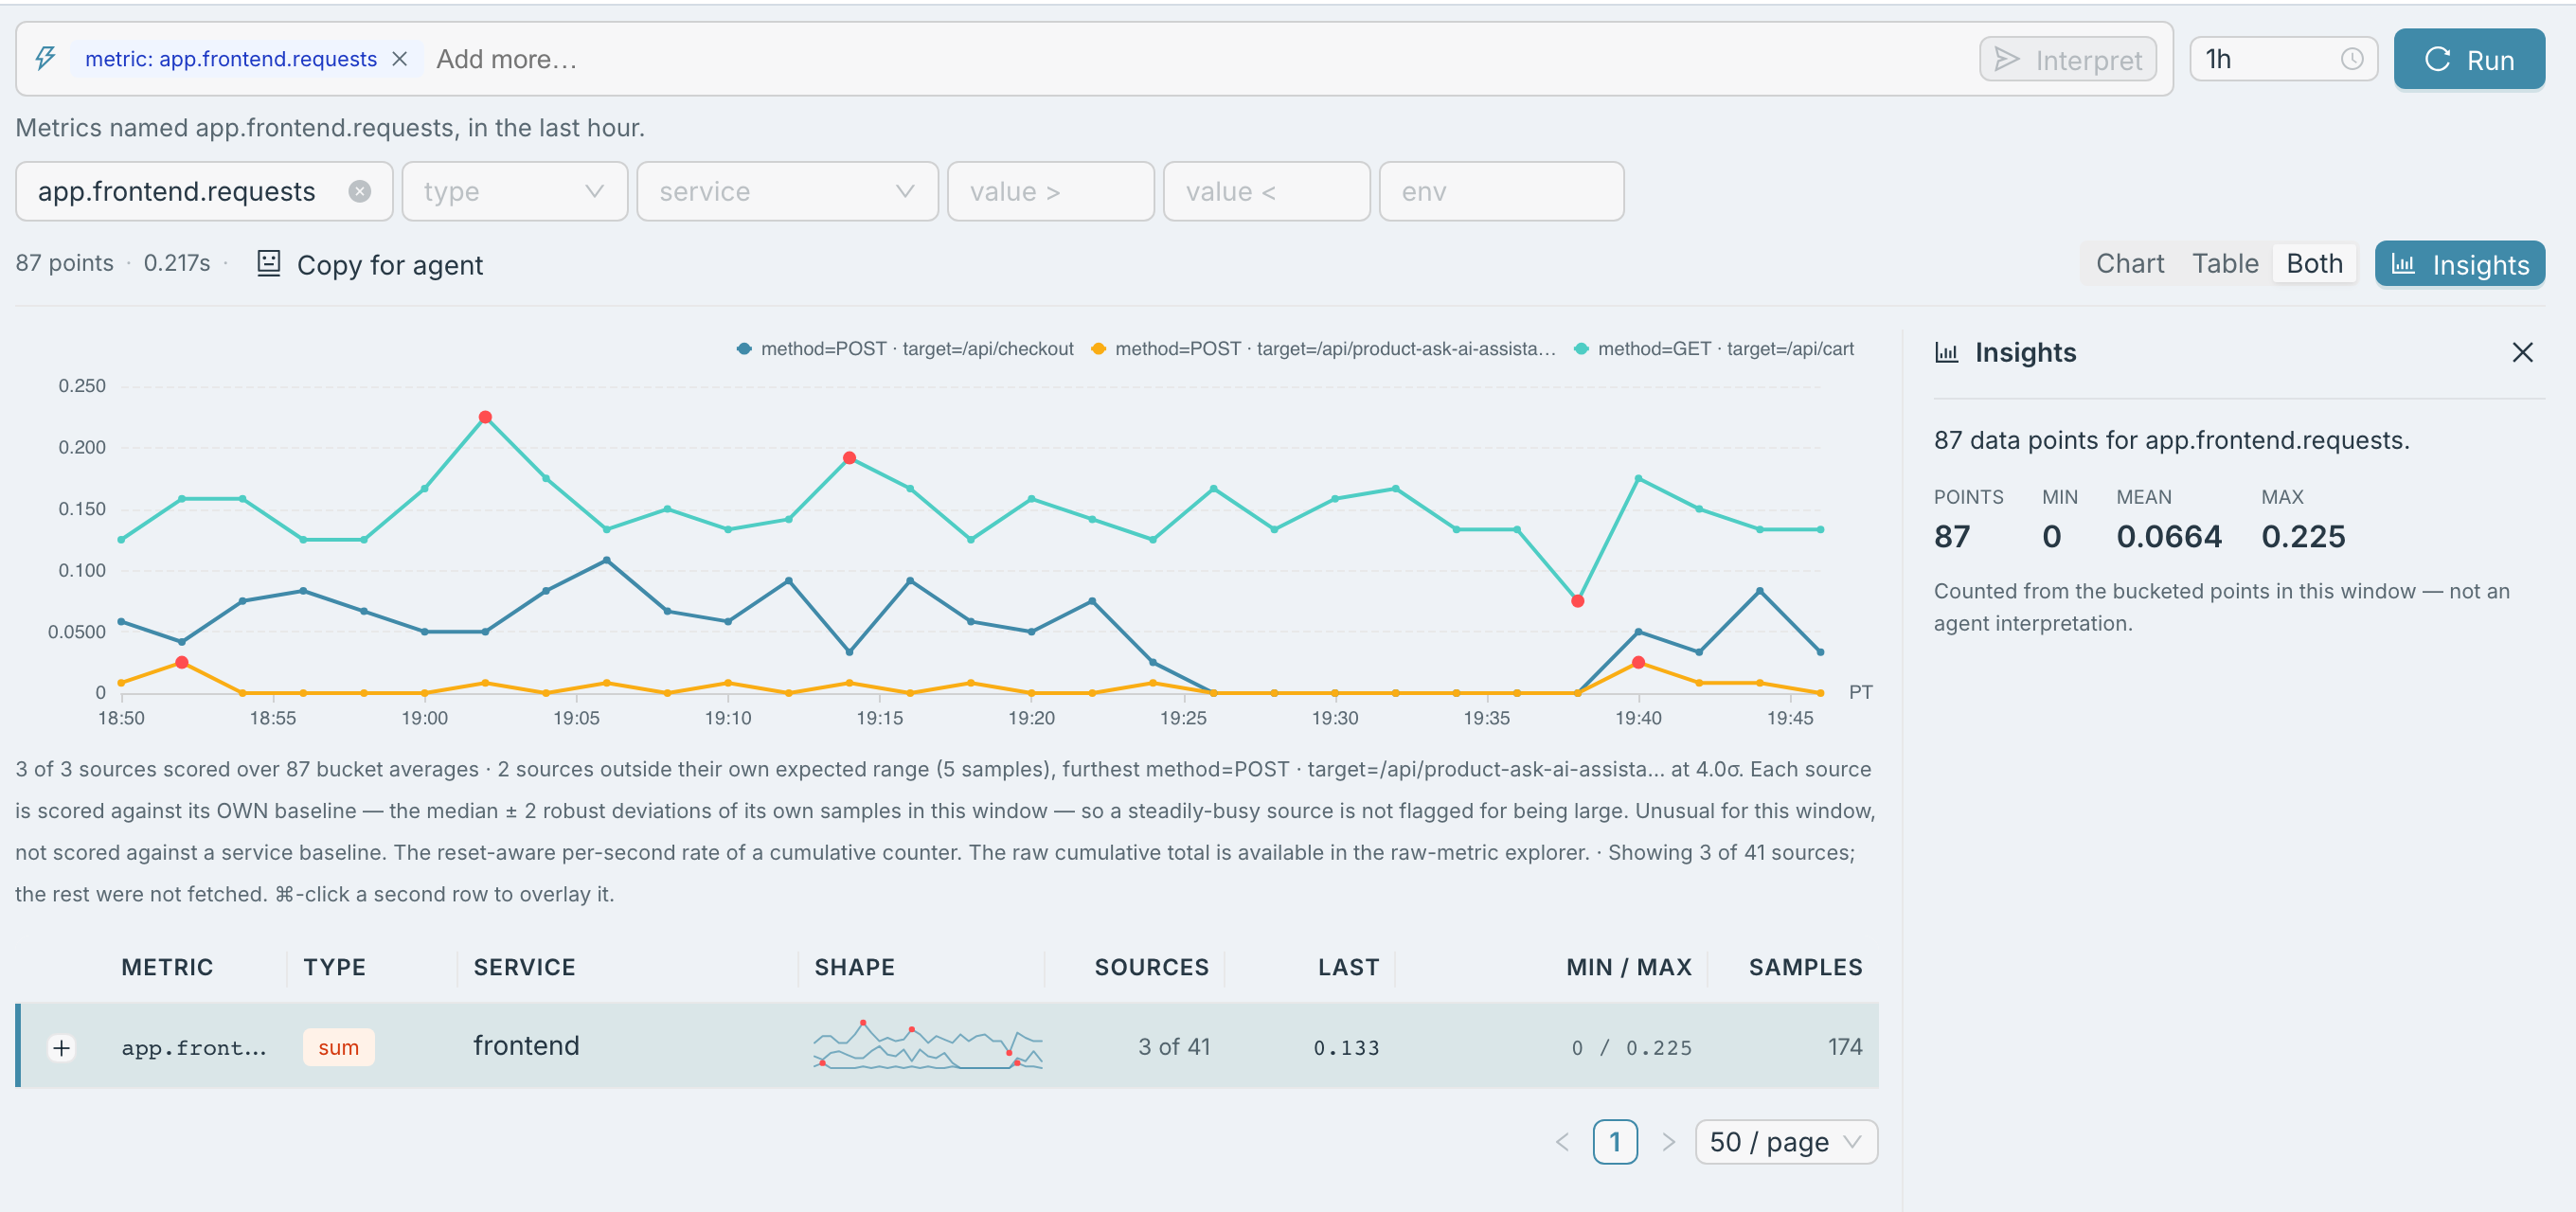
Metric Explorer opens on the last hour of the metrics your services send over OpenTelemetry, one row per metric. Click a row and its series is charted source by source. I mark the points that left their expected range, so the unusual moment is already pointed out when the chart draws.
It lives under Exploration → Metric Explorer.
Ask, or filter
Section titled “Ask, or filter”Type what you want into the query bar — “cpu utilization over 0.9 in the last hour” — and press Interpret (or Enter). The filters it understood appear as pills and the query runs. Set the window with the range control: a time in the question doesn’t change it. See Ask in plain English.
Or set the filters yourself, then press Run:
| Filter | Keeps |
|---|---|
| metric name | metrics with that name |
| type | gauge, sum, or both |
| service | metrics from the services you pick; click a namespace heading to take all of it |
| value > / value < | points above or below a number |
| env | metrics from that environment |
The range offers 15m, 1h, 3h, 24h and 7d — 1h the first time, then the last range you picked in any explorer. If a query comes back empty because of your filters, the explorer names each filter that emptied it, with how many points you’d see without it and a Remove filter button.
Read the table
Section titled “Read the table”Each row is one metric: Metric, Type, Service, a Shape sparkline with its unusual points marked, Sources (how many of its sources are charted, out of how many there are), Last, Min / Max and Samples. Values carry their units; hover one for the full figure.
Chart a series
Section titled “Chart a series”With no row picked, the chart shows one metric from your results; add a metric name filter to choose which. Click a row to chart that metric instead: one line per source, with the points outside a source’s expected range marked in red. The caption under the chart says how many sources and samples left their range, and which source strayed furthest. Click the row again to go back.
⌘-click (Ctrl-click on Windows and Linux) a second row to overlay it on the first, for two metrics on one chart.
A value > or value < filter also draws as a dashed threshold line, so you can see which points cross it. Click a bar on the overview chart, or drag across several, to narrow the query to that stretch of time; clicking the time pill puts your previous range back.
From a metric to its traces
Section titled “From a metric to its traces”Expand a row for the metric’s attributes, its resource attributes, and example traces (exemplars): up to five traces recorded at the moment of a sample, each with that sample’s value. Click one and the trace opens in a drawer over the page, so a spike on the chart is one click from the request behind it. An exemplar whose trace is no longer kept shows struck through.
Insights and the hand-off
Section titled “Insights and the hand-off”The Insights rail sums up what you fetched: the number of points, their minimum, mean and maximum, and what stands out — the services reporting and which one sends the most.
Copy for agent appears in two places. Beside the point count it copies the whole result; inside an expanded row it copies that one metric, with the samples that left their source’s expected range.
Arriving from another view
Section titled “Arriving from another view”Metric Signals and the Metrics tab of a service in Service Topology open Metric Explorer already scoped to the service, the time range and, where there is one, the metric. If your workspace hasn’t sent OTLP metrics in the last day, the explorer says so and links you to Traces and Metric Signals, where request rate, errors and latency are read from your traces.
The query rides in the page address, so a refresh, the Back button or a shared link opens the same filters and range.