Compare traces
A slow request is easier to explain beside one that wasn’t. Trace Diff puts the two side by side and against what the service normally does, then marks every operation that was added, went missing or slowed down. Open it and I’ve already picked the slowest trace for you and, where one fits, paired it with the closest-shaped healthy trace.
Where you’ll find it
Section titled “Where you’ll find it”You’ll find Trace Diff in three places:
- On a service in Service Topology. Click a service and its drawer opens on the Trace Diff tab, beside Metrics and Logs.
- On a path in Critical Paths. Select a path and the Explore panel opens with Trace Diff scoped to the path’s flagged hop. Click another hop above the panel to compare there instead.
- In Critical Paths’ In-Service mode, in the centre panel. Click a service in the list on the left. Its callers are listed under it; pick one to compare only the traffic from that caller.
The pair you pick rides in the page address, so a link you share opens the same comparison.
Pick the two traces
Section titled “Pick the two traces”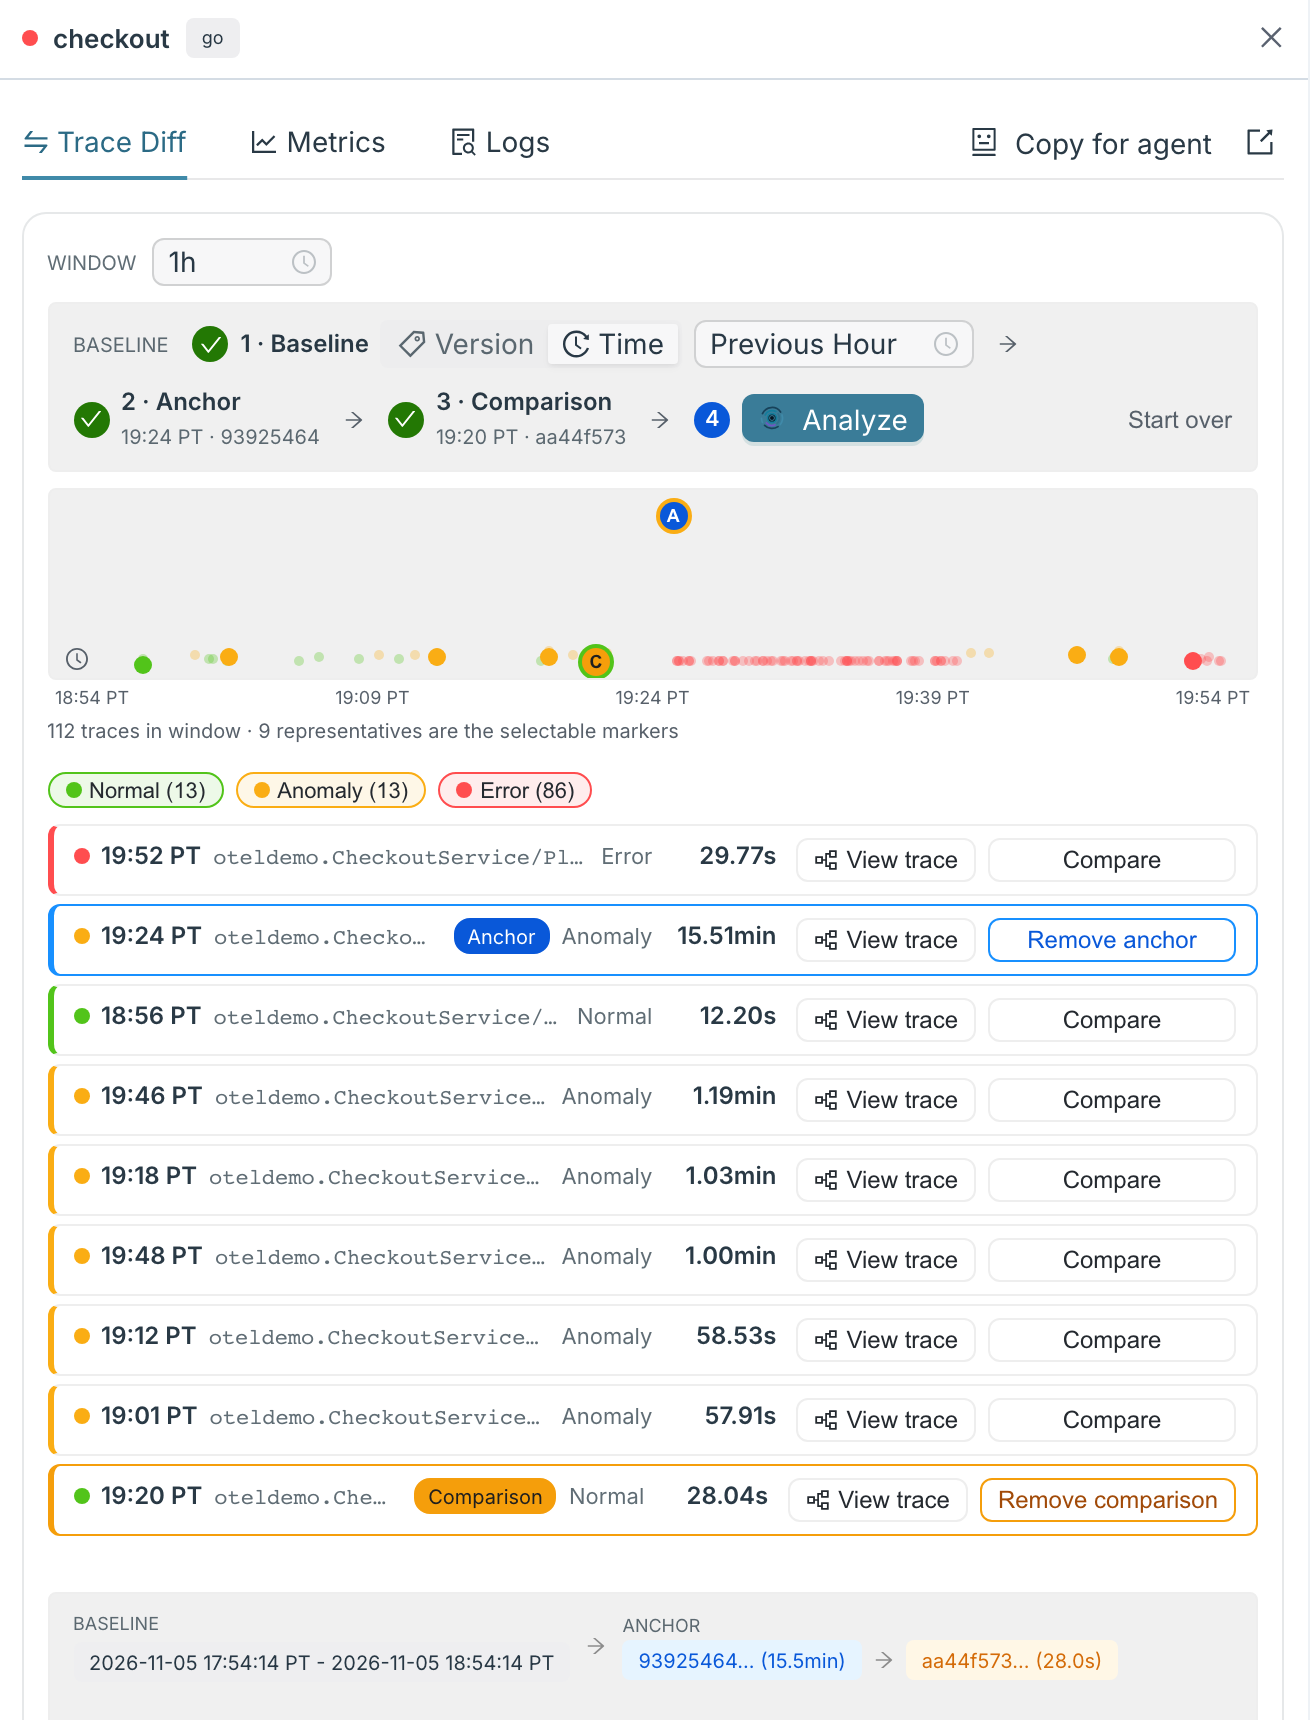
The steps across the top follow the comparison, each ticked as it’s set:
-
Baseline — what normal looks like. Choose Time and the Previous Hour, Previous Day or Previous Week, or, where your service reports versions, choose Version and pick a release. On a Critical Paths path the baseline is a time window.
-
Anchor — the trace you’re investigating. I pick the slowest one for you; a note above the timeline says which I picked and what I paired it with. Pick another jumps to the list, and × clears my choice.
-
Comparison — optional, a second trace to hold the anchor against. Without one, the anchor is compared with the baseline alone.
-
Analyze — once both traces are set, I read the pair for you, attribute by attribute.
WINDOW sets how far back the traces come from: 1h, 6h, 24h, 7d or 14d.
The timeline draws every trace in the window as a dot, with the selectable ones larger, and marks your anchor A and comparison C. The list below holds those selectable traces; filter it to Normal, Anomaly or Error. Each row has View trace and a button to Set anchor, Compare, or remove the trace from the pair. A trace that takes a different route through your services reads Different path and can’t be compared, since there’d be nothing to line up.
Start over clears the pair.
Read the difference
Section titled “Read the difference”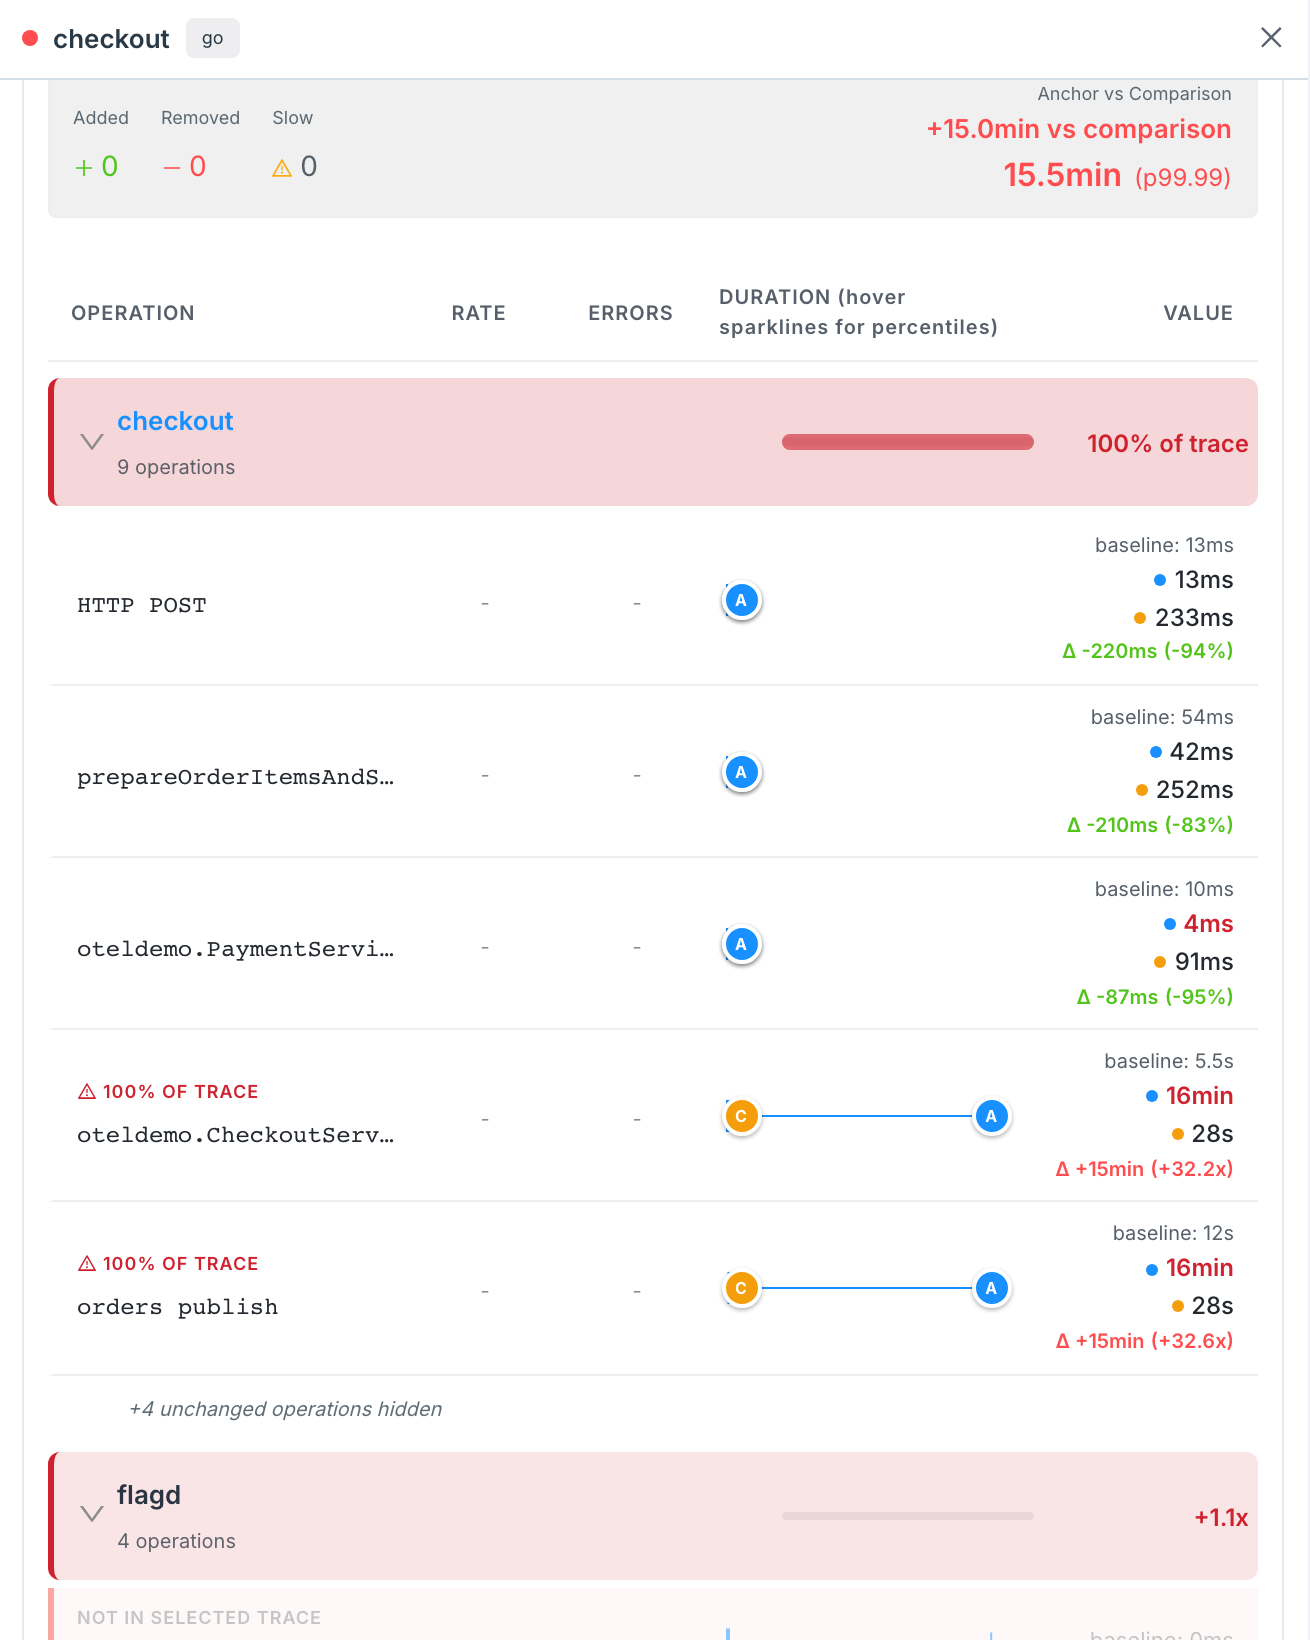
The summary counts the operations Added, Removed and Slow, and measures the anchor against the comparison. Beside the anchor’s duration is its percentile in the baseline — red at p95 and above — and hovering it shows the baseline’s p50, p95 and maximum.
The table groups operations by service. Each service heading shows its operations, how many are new, removed or slow, and its share of the trace; click it to open or fold it. Each operation shows:
- a status: NEW IN CURRENT for an operation the baseline never had, REMOVED (was in baseline) struck through for one that went missing, and N.Nx SLOWER, SLOWDOWN or NN% OF TRACE where the time went;
- its duration against the baseline’s range, with the anchor and comparison marked A and C;
- the value: the baseline figure, the anchor’s (blue) and the comparison’s (orange), and the change.
Operations and services that didn’t change are folded away so the difference stands out; the Show … unchanged services button at the bottom brings them back.
Let me read the pair
Section titled “Let me read the pair”Press Analyze and the pair opens in a panel. I compare every span the two traces share, attribute by attribute, and write up what the differences mean. You get:
- whether the two traces take comparable or divergent paths, and how much of their shape they share;
- the top changes, then each service’s spans with every attribute side by side — Anchor, Comparison, and whether it was Added, Removed or Changed; Diffs only hides the attributes that match;
- the operations that appear in only one of the two;
- links to open either trace.
When the traces take different paths, a per-attribute comparison is likely noise, so I say so first and leave the choice to you with Compare attributes anyway.
Copy for agent at the top of the Trace Diff tab copies the comparison — the attribute differences and the operations only one trace has — as text for your own coding agent. The same button in the analysis panel adds my analysis.